

Below you will find information on our service performance. This includes lateness of our trains, number of trains ran, our timekeeping performance and how we performed in the latest NRPS surveys. Our performance figures are published on a four weekly basis called rail periods.
- Customer Experience Survey (CES)
- My journey
- Service Quality Regime Results
- Introducing the Customer Information Pledges
- Stakeholder Engagement Strategy
Customer experience survey (CES)
The National Rail Passenger Survey (NRPS) programme has been on hold since spring 2020. Since then, we have created our own customer experience survey (CES). The below tables indicate customer satisfaction across a selection of customer touchpoints, comparing the most recent NRPS performance against the CES, where possible. Note that the scores are not comparable owing to vastly different survey methodologies, a much-changed set of customer expectations stemming from the pandemic and key differences in service provision across the time period owing to the pandemic. Examples of the latter would include reduced timetabling and on-board catering provision.
Trains
| NRPS Spring 2022 | CES 2024 full year | |
| Overall trains satisfaction | 82% | |
| Personal security on-board | 83% | |
| Cleanliness on the inside of the train | 77% | 52% |
| Comfort of the seats | 70% | 48% |
| Toilet facilities | 59% | 38% |
| Trains average | 74% | 46% |
Customer Service
| NRPS Spring 2022 | CES 2024 full year | |
| Provision of information during journey | 82% | 57% |
| Helpfulness and attitude of staff | 83% | 64% |
| How well TOC dealt with delays | 77% | 29% |
| Availability of staff on the train | 70% | 46% |
| Customer service average | 74% | 49% |
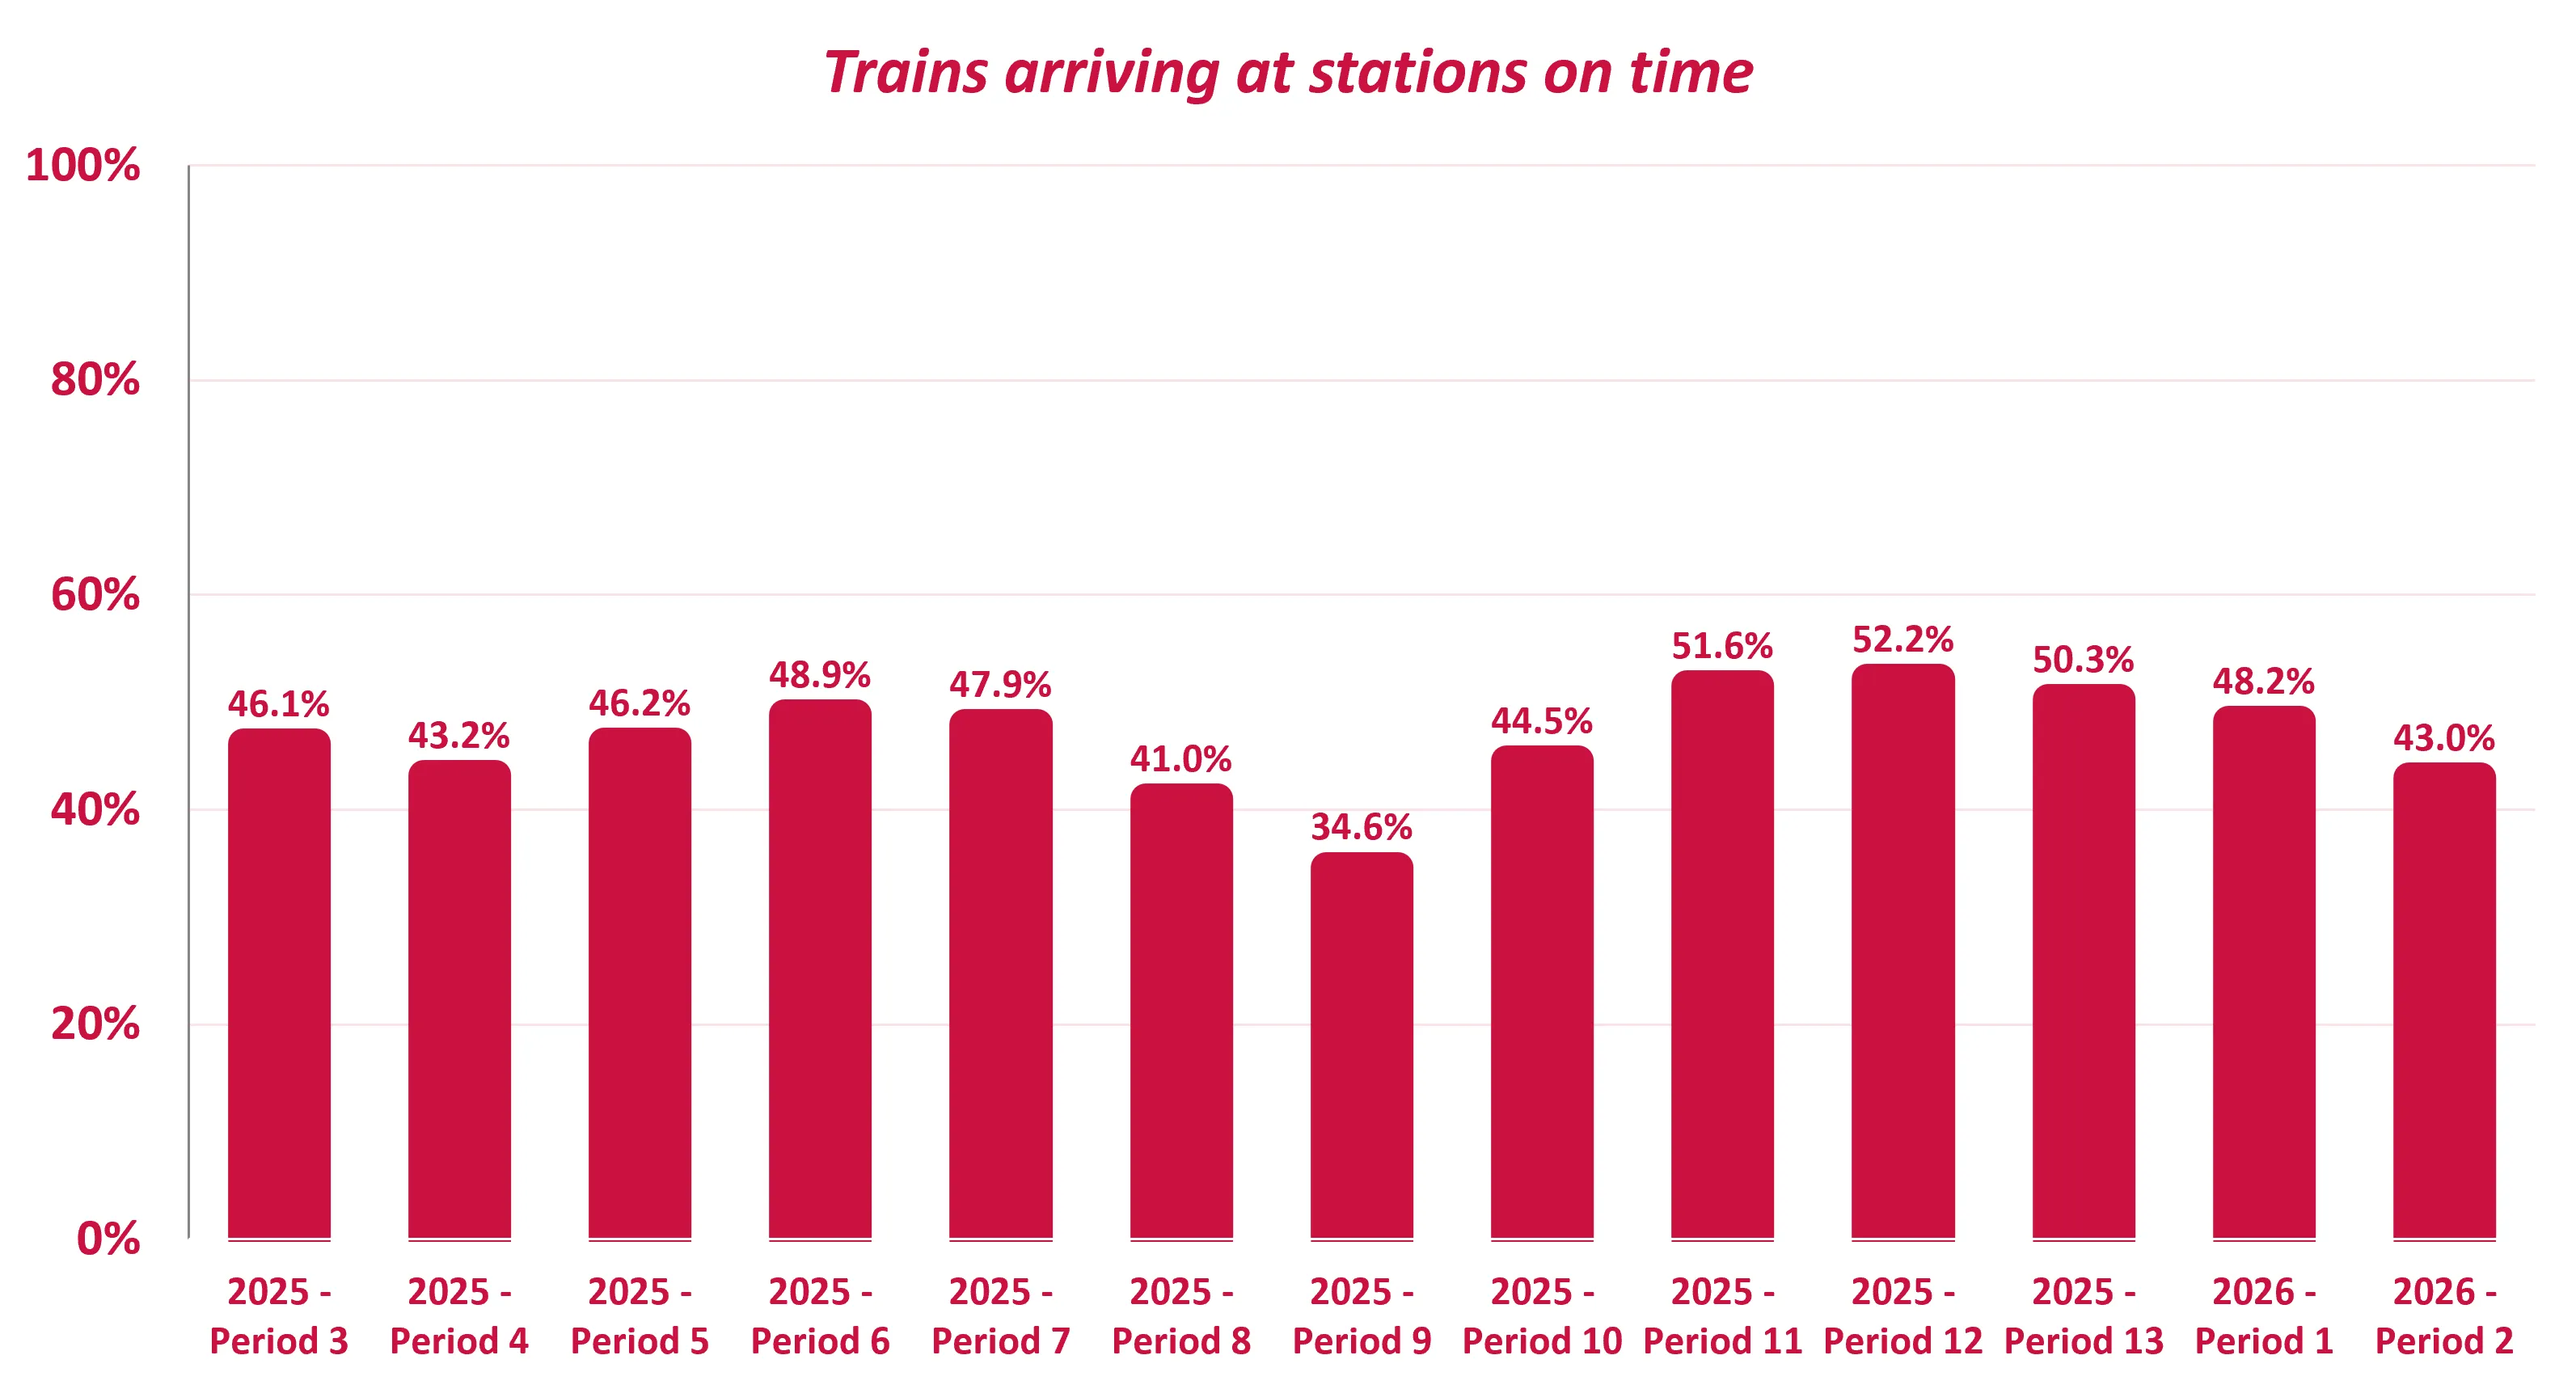
| On Time Figures | Inter-city* | Inter Regional* | Overall | |||
| Rail Period | Actual | % | Actual | % | Actual | % |
| 2022 Period 8 | 13576 | 38.9% | 11179 | 43.2% | 24755 | 40.7% |
| Period 13 | 17475 | 52.1% | 15400 | 54.6% | 32875 | 52.2% |
| 2023 Period 1 | 19216 | 51.6% | 16669 | 53.7% | 35885 | 52.6% |
| Period 13 | 22692 | 50.7% | 17947 | 55.1% | 40639 | 52.5% |
| 2024 Period 1 | 20152 | 50.0% | 14945 | 51.5% | 35097 | 50.6% |
| Period 13 | 25719 | 52.9% | 21286 | 60.4% | 47005 | 56.0% |
| 2025 | ||||||
| Period 1 | 22523 | 52.9% | 17880 | 58.4% | 40403 | 55.2% |
| Period 13 | 24024 | 46.5% | 20656 | 55.4% | 44680 | 50.3% |
| 2026 Period 1 | 24530 | 43.3% | 21774 | 55.4% | 46304 | 48.2% |
| Period 2 | 18545 | 38.8% | 16065 | 50.1% | 34610 | 43.0% |
| Period 3 | 18391 | 37.5% | 14626 | 46.7% | 33017 | 41.1% |
Trains arriving at stations within 3 minutes of schedule
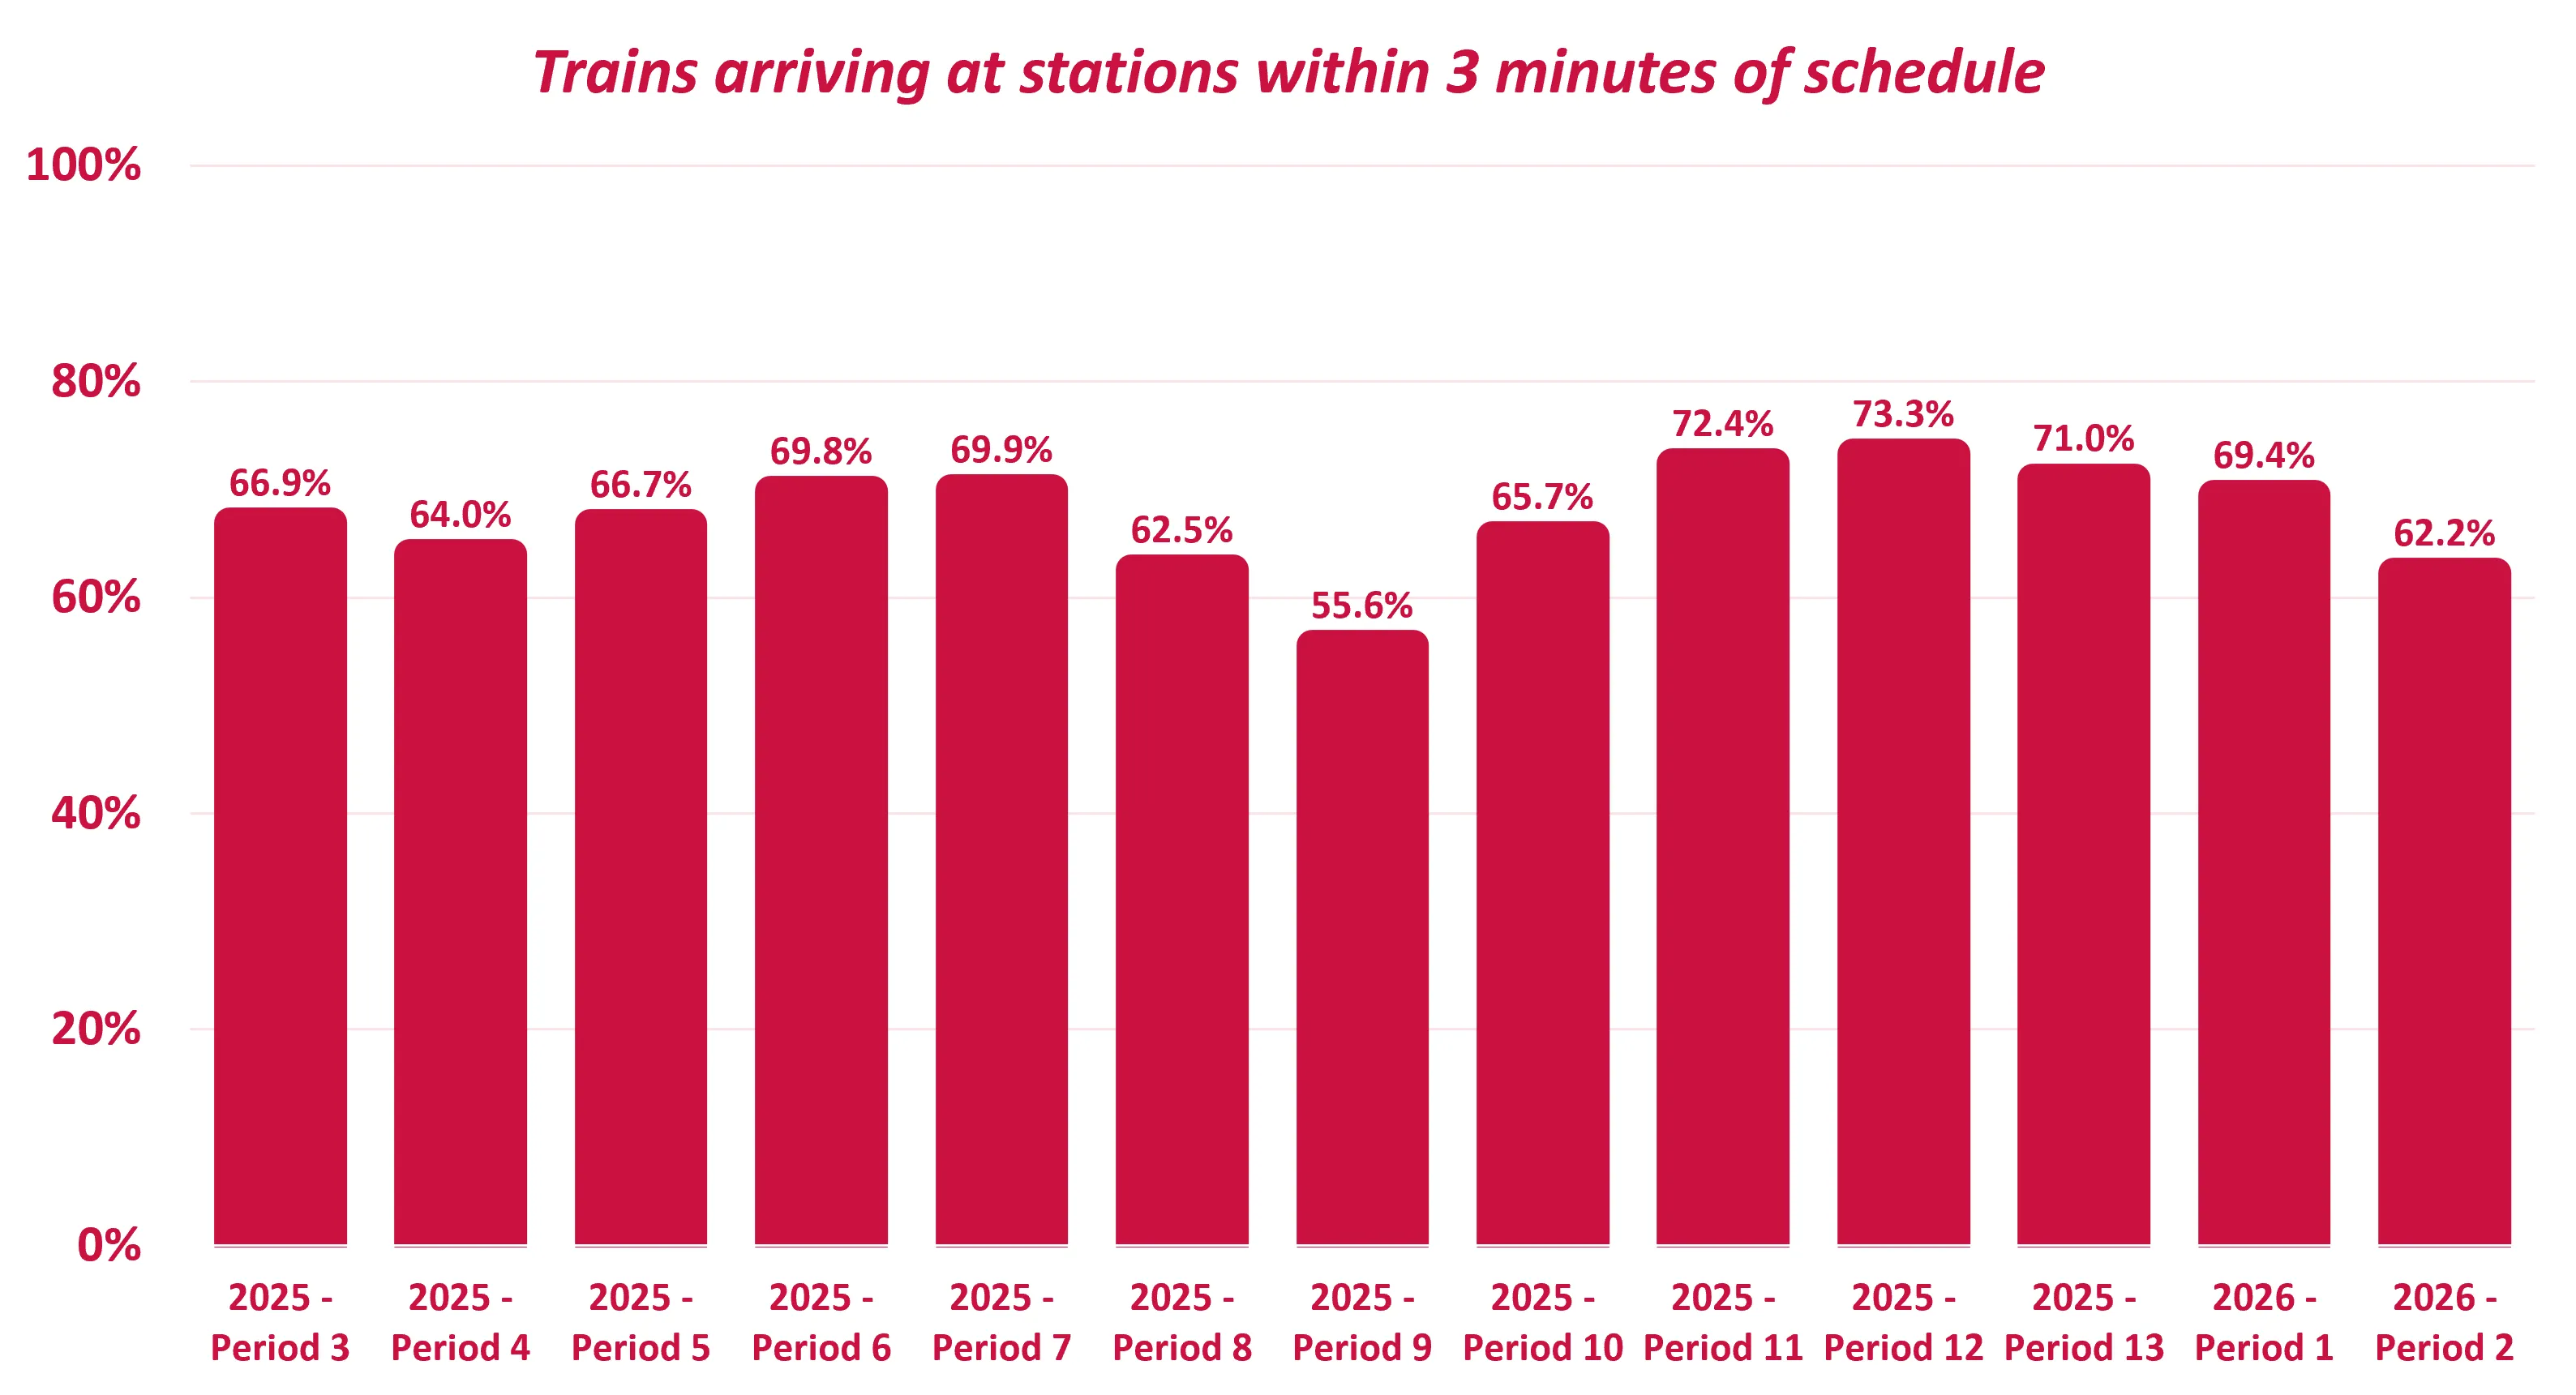
| Time to 3 Figures | Inter-city* | Inter Regional* | Overall | |||
| Rail Period | Actual | % | Actual | % | Actual | % |
| 2022 Period 8 | 20366 | 58.3% | 17265 | 66.7% | 37631 | 61.9% |
| Period 13 | 24374 | 72.6% | 21794 | 77.3% | 46168 | 74.8% |
| 2023 Period 1 | 26932 | 72.4% | 23611 | 76.0% | 50543 | 74.0% |
| Period 13 | 31462 | 70.3% | 24916 | 76.5% | 556378 | 72.9% |
| 2024 Period 1 | 28567 | 70.9% | 21928 | 75.5% | 50495 | 72.8% |
| Period 13 | 36099 | 74.3% | 28491 | 80.8% | 64590 | 77.0% |
| 2025 | ||||||
| Period 1 | 31209 | 73.5% | 24265 | 79.2% | 55555 | 75.9% |
| Period 13 | 34787 | 67.4% | 28322 | 76.0% | 63109 | 71.0% |
| 2026 Period 1 | 36801 | 65.0% | 29854 | 75.9% | 66655 | 69.4% |
| Period 2 | 27707 | 57.2% | 22394 | 69.8% | 50101 | 62.2% |
| Period 3 | 28059 | 57.3% | 21233 | 67.8% | 49292 | 61.4% |
Trains arriving at stations within 15 minutes of schedule
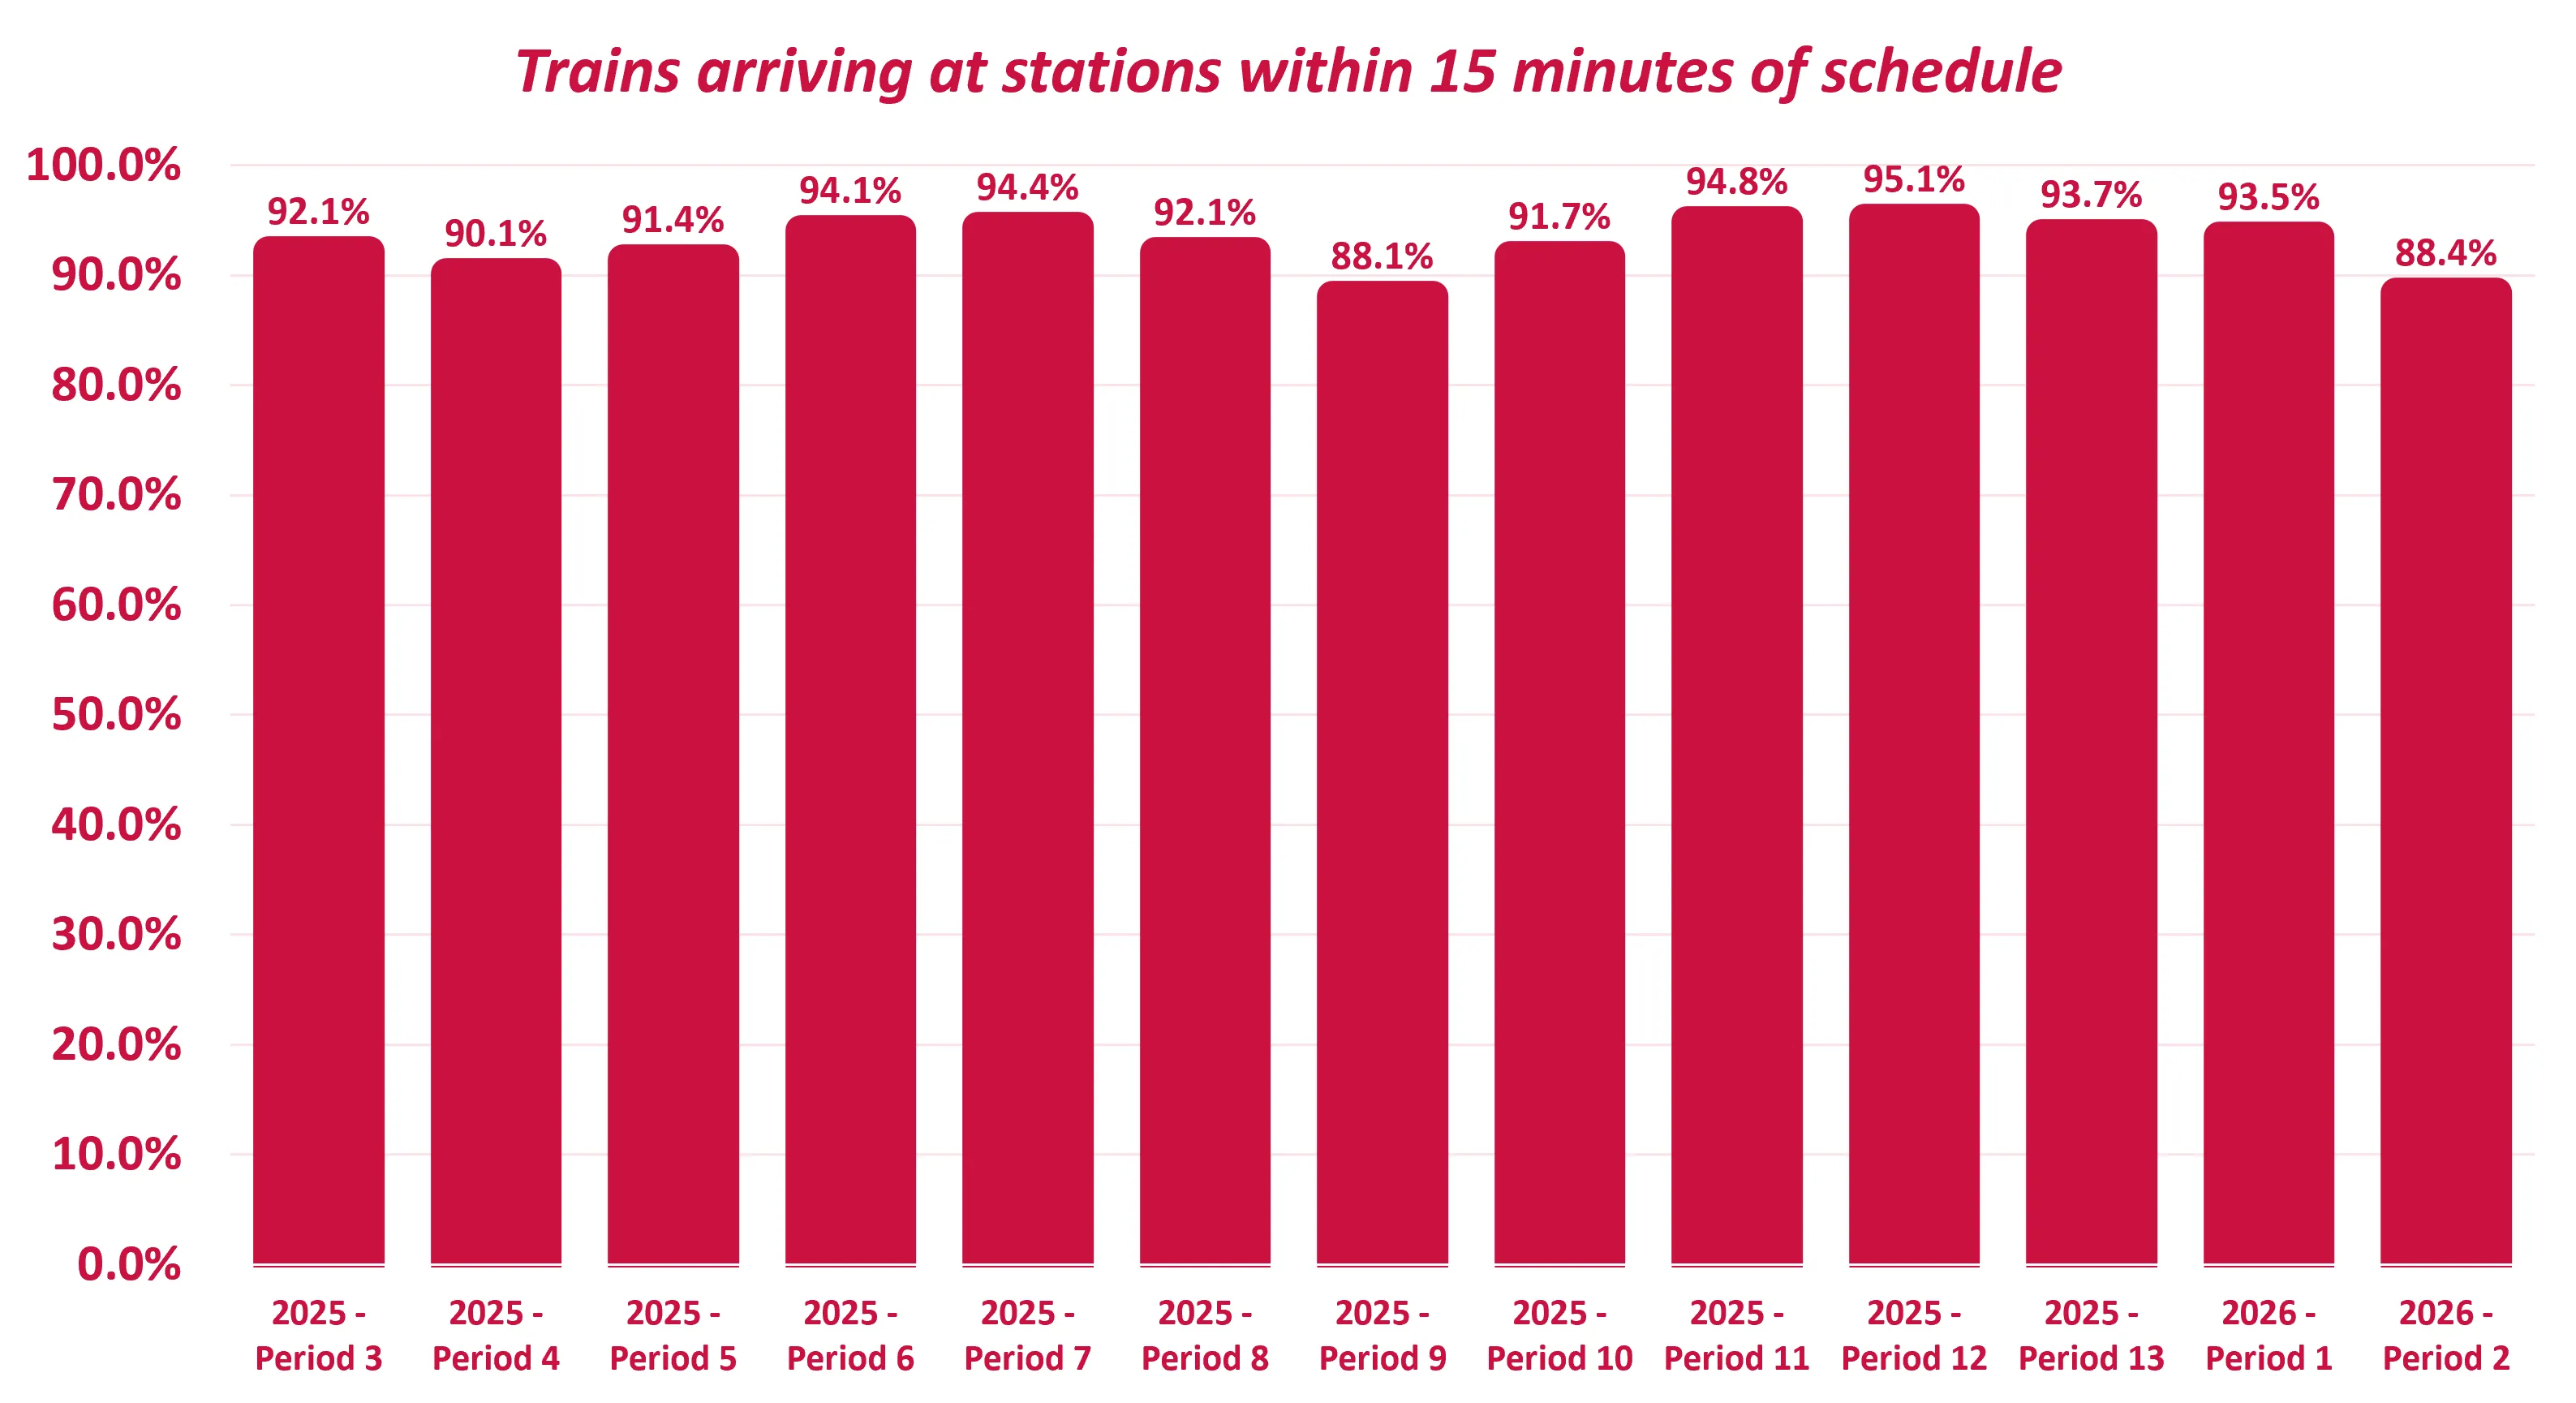
| Time to 15 Figures | Inter-city* | Inter Regional* | Overall | |||
| Rail Period | Actual | % | Actual | % | Actual | % |
| 2022 Period 8 | 30873 | 88.4% | 24587 | 95.0% | 55460 | 91.2% |
| Period 13 | 31676 | 94.4% | 27528 | 97.6% | 59204 | 95.9% |
| 2023 Period 1 | 34754 | 93.4% | 30133 | 97.0% | 64887 | 95.1% |
| Period 13 | 41506 | 92.7% | 31674 | 97.2% | 73180 | 94.6% |
| 2024 Period 1 | 37444 | 92.9% | 28127 | 96.8% | 65571 | 94.6% |
| Period 13 | 45866 | 94.4% | 34521 | 97.9% | 80387 | 95.9% |
| 2025 | ||||||
| Period 1 | 40110 | 94.3% | 29810 | 97.4% | 69920 | 95.6% |
| Period 13 | 47378 | 91.8% | 35925 | 96.4% | 83303 | 93.7% |
| 2026 Period 1 | 51759 | 91.4% | 37943 | 96.5% | 89702 | 93.5% |
| Period 2 | 41219 | 85.1% | 29903 | 93.2% | 71122 | 88.4% |
| Period 3 | 42281 | 86.3% | 29274 | 93.4% | 71555 | 89.1% |
All Cancellations figures
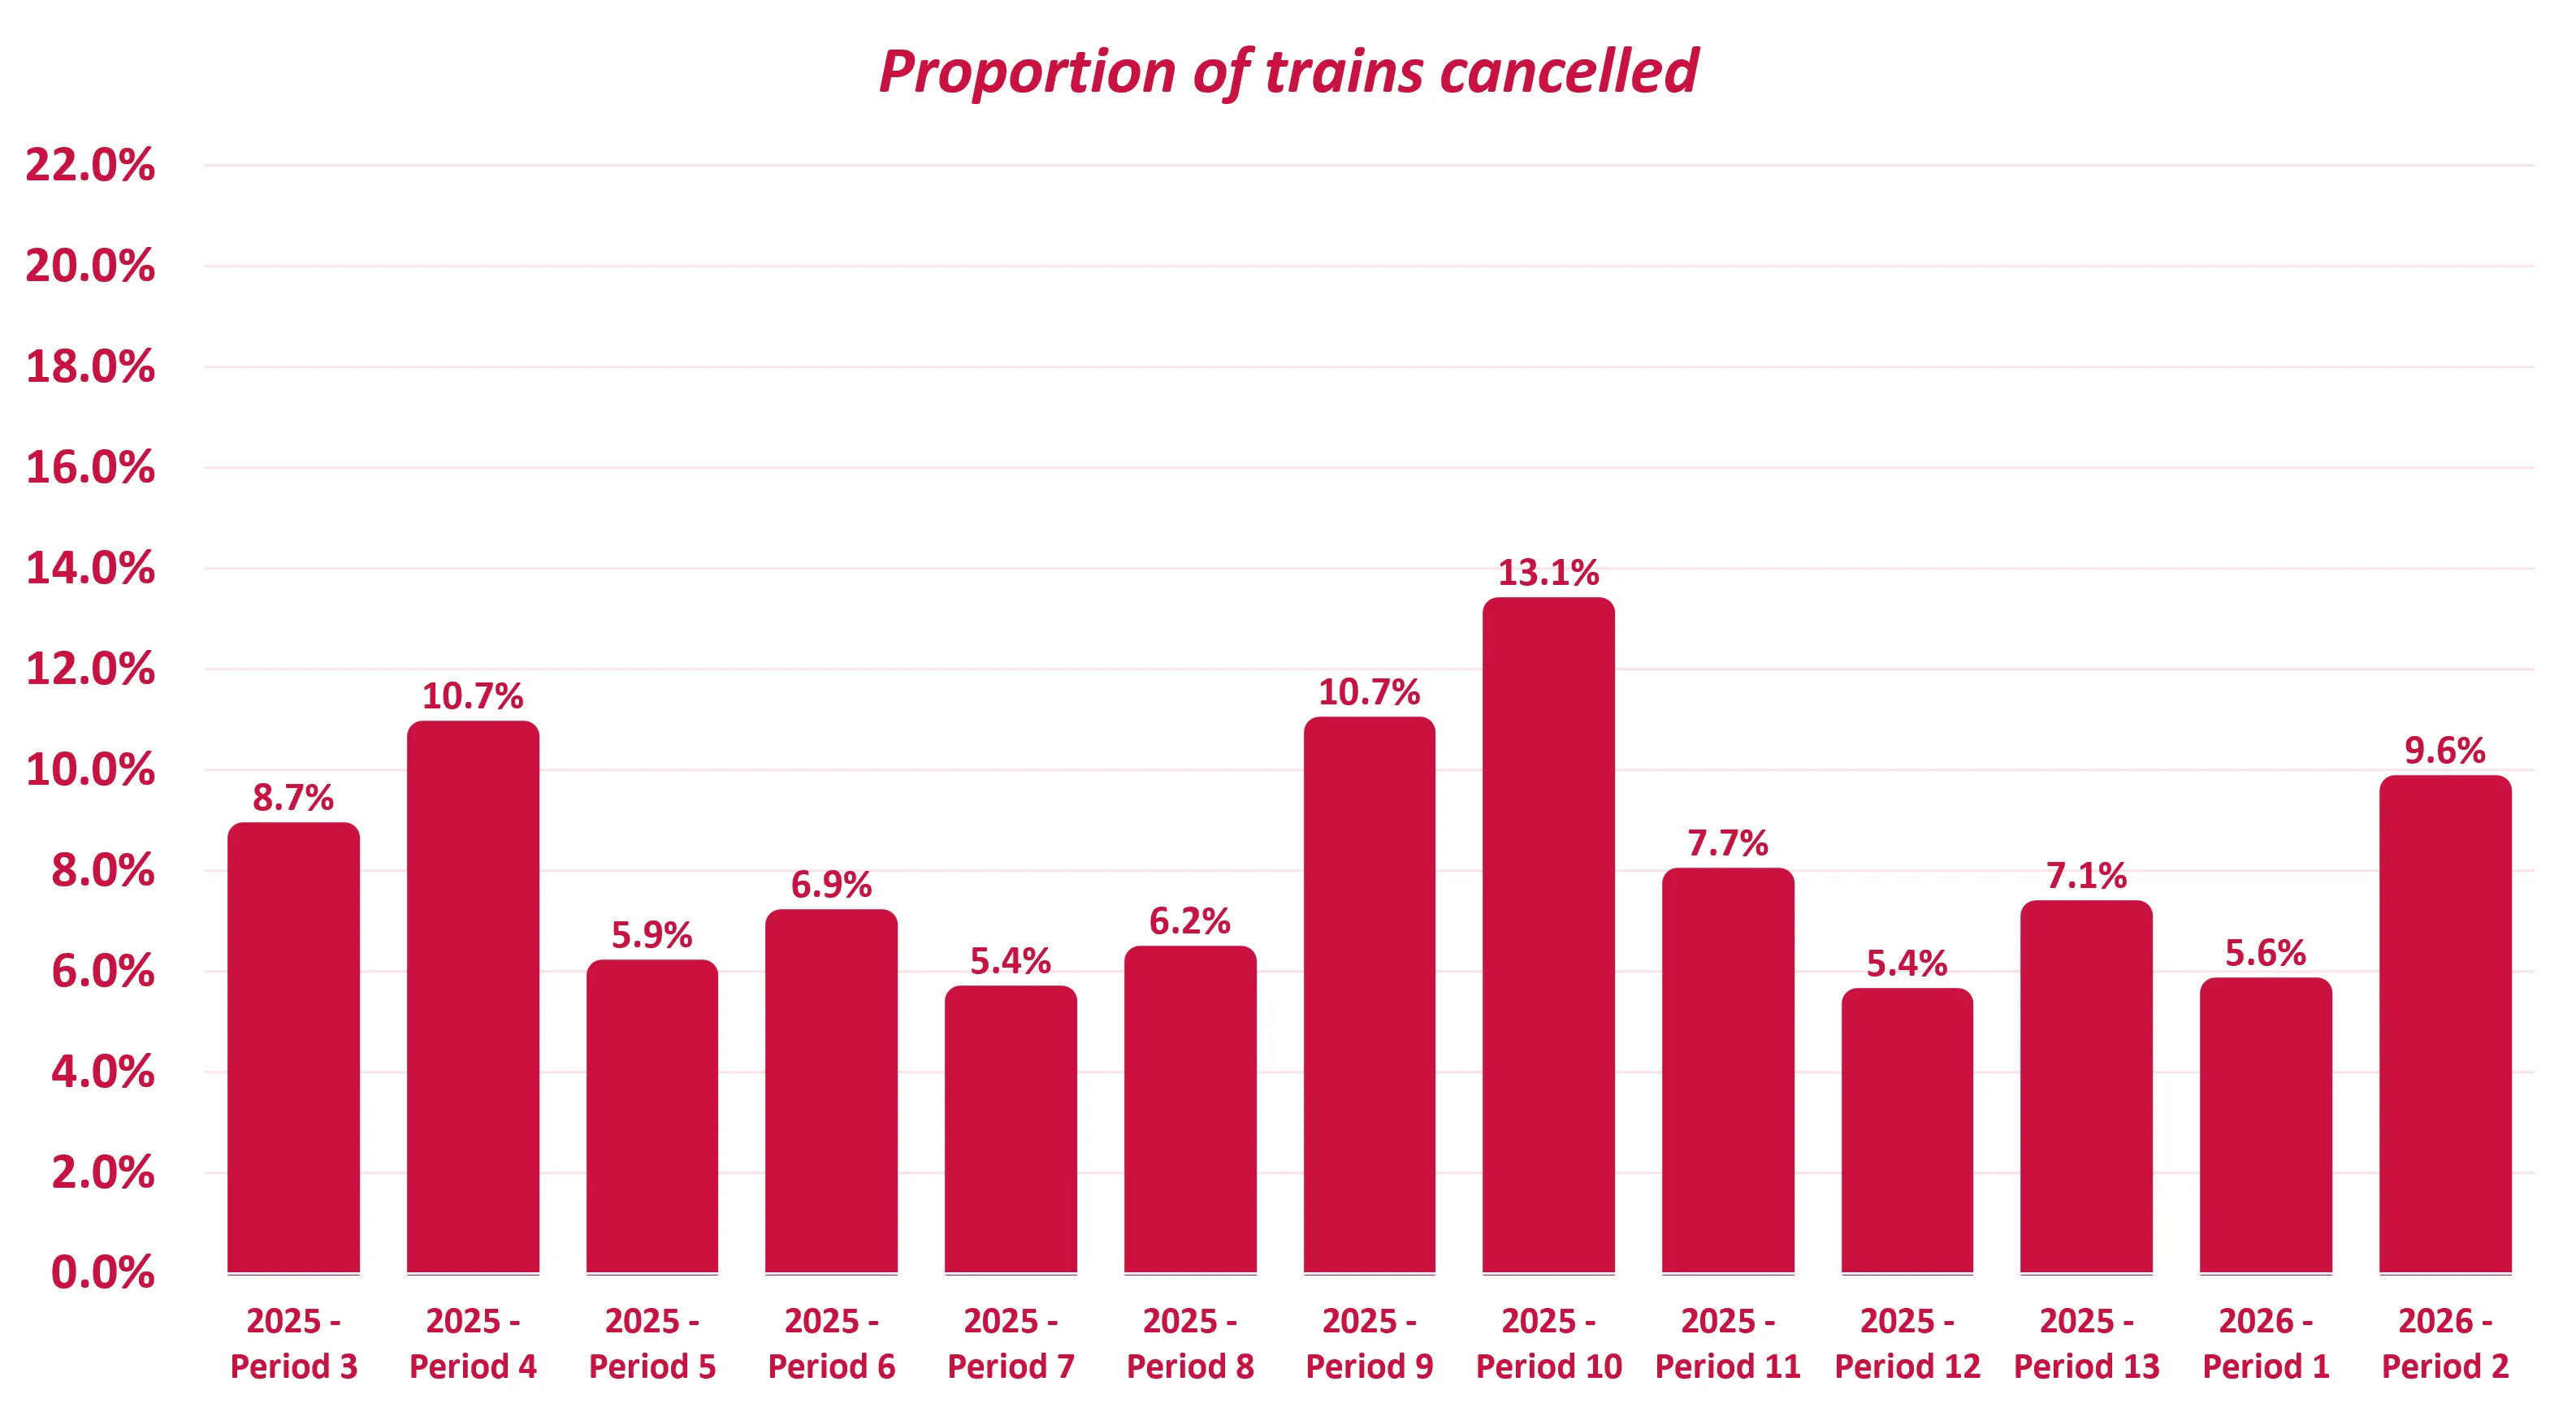
| All Cancellations Figures | Inter-city* | Inter Regional* | Overall | |||
| Rail Period | Actual | % | Actual | % | Actual | % |
| 2022 Period 8 | 194 | 7.2% | 472 | 13.6% | 666 | 10.8% |
| Period 13 | 88.5 | 3.4% | 113 | 3.6% | 201.5 | 3.5% |
| 2023 Period 1 | 189.5 | 5.5% | 179 | 5.6% | 368.5 | 5.5% |
| Period 13 | 154.5 | 4.7% | 90 | 2.5% | 244.5 | 3.5% |
| 2024 Period 1 | 190.5 | 6.7% | 143.5 | 4.4% | 334 | 5.5% |
| Period 13 | 178.5 | 5.0% | 190.5 | 4.9% | 369 | 5.0% |
| 2025 | ||||||
| Period 1 | 182.5 | 6.1% | 298.5 | 8.6% | 481 | 7.5% |
| Period 13 | 314 | 7.9% | 251.5 | 6.3% | 565.5 | 7.1% |
| 2026 Period 1 | 235.5 | 5.9% | 220 | 5.2% | 455.5 | 5.6% |
| Period 2 | 325.5 | 9.1% | 365 | 10.1% | 690.5 | 9.6% |
| Period 3 | 294.5 | 8.5% | 315.5 | 8.8% | 610 | 8.7% |
Short Formation figures
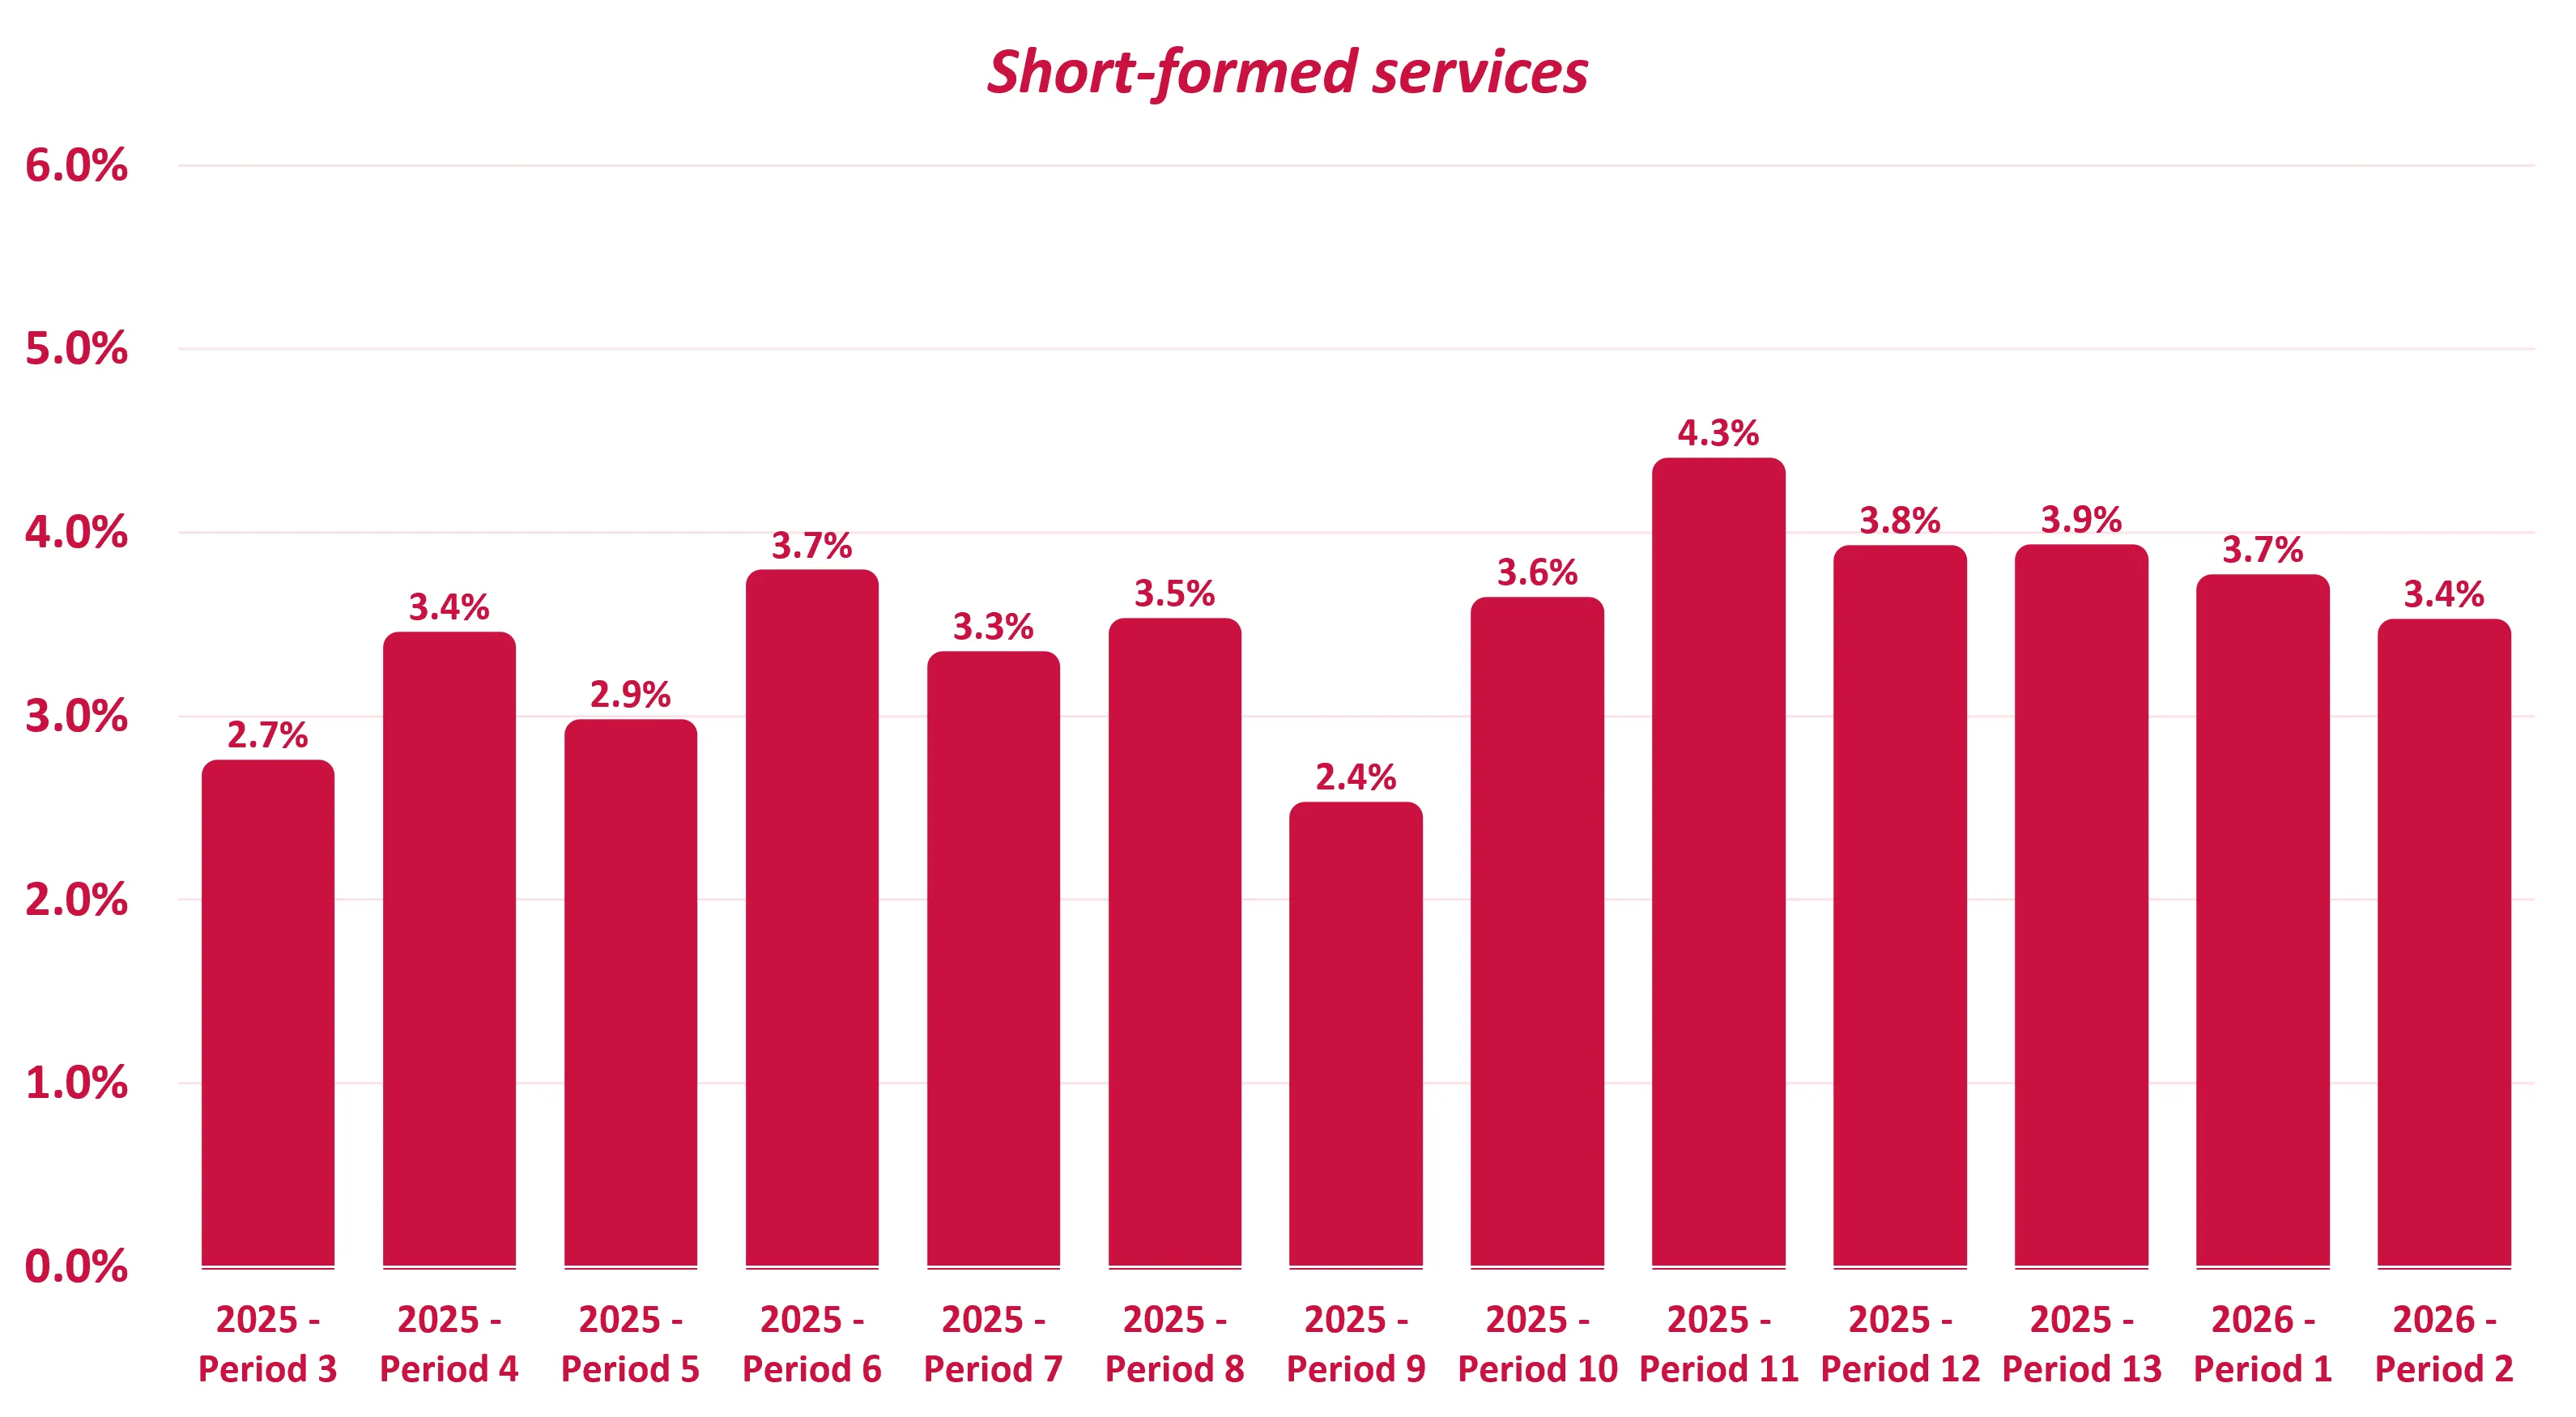
| Short Formation Figures | Inter-city* | Inter Regional* | Overall | |||
| Rail Period | Actual | % | Actual | % | Actual | % |
| 2022 Period 8 | 53 | 2.2% | 48 | 1.6% | 101 | 1.9% |
| Period 13 | 132 | 5.3% | 21 | 0.7% | 153 | 2.8% |
| 2023 Period 1 | 220 | 6.8% | 28 | 0.9% | 248 | 4.0% |
| Period 13 | 194 | 6.4% | 48 | 1.4% | 242 | 3.7% |
| 2024 Period 1 | 210 | 8.2% | 19 | 0.6% | 229 | 4.1% |
| Period 13 | 204 | 6.2% | 11 | 0.3% | 215 | 3.1% |
| 2025 | ||||||
| Period 1 | 198 | 7.3% | 33 | 1.1% | 231 | 4.0% |
| Period 13 | 190 | 5.5% | 86 | 2.3% | 276 | 3.9% |
| 2026 Period 1 | 237 | 6.6% | 41 | 1.0% | 278 | 3.7% |
| Period 2 | 173 | 5.6% | 43 | 1.4% | 216 | 3.4% |
| Period 3 | 205 | 6.8% | 80 | 2.5% | 285 | 4.6% |
Trains arriving at destination 30-59 minutes late
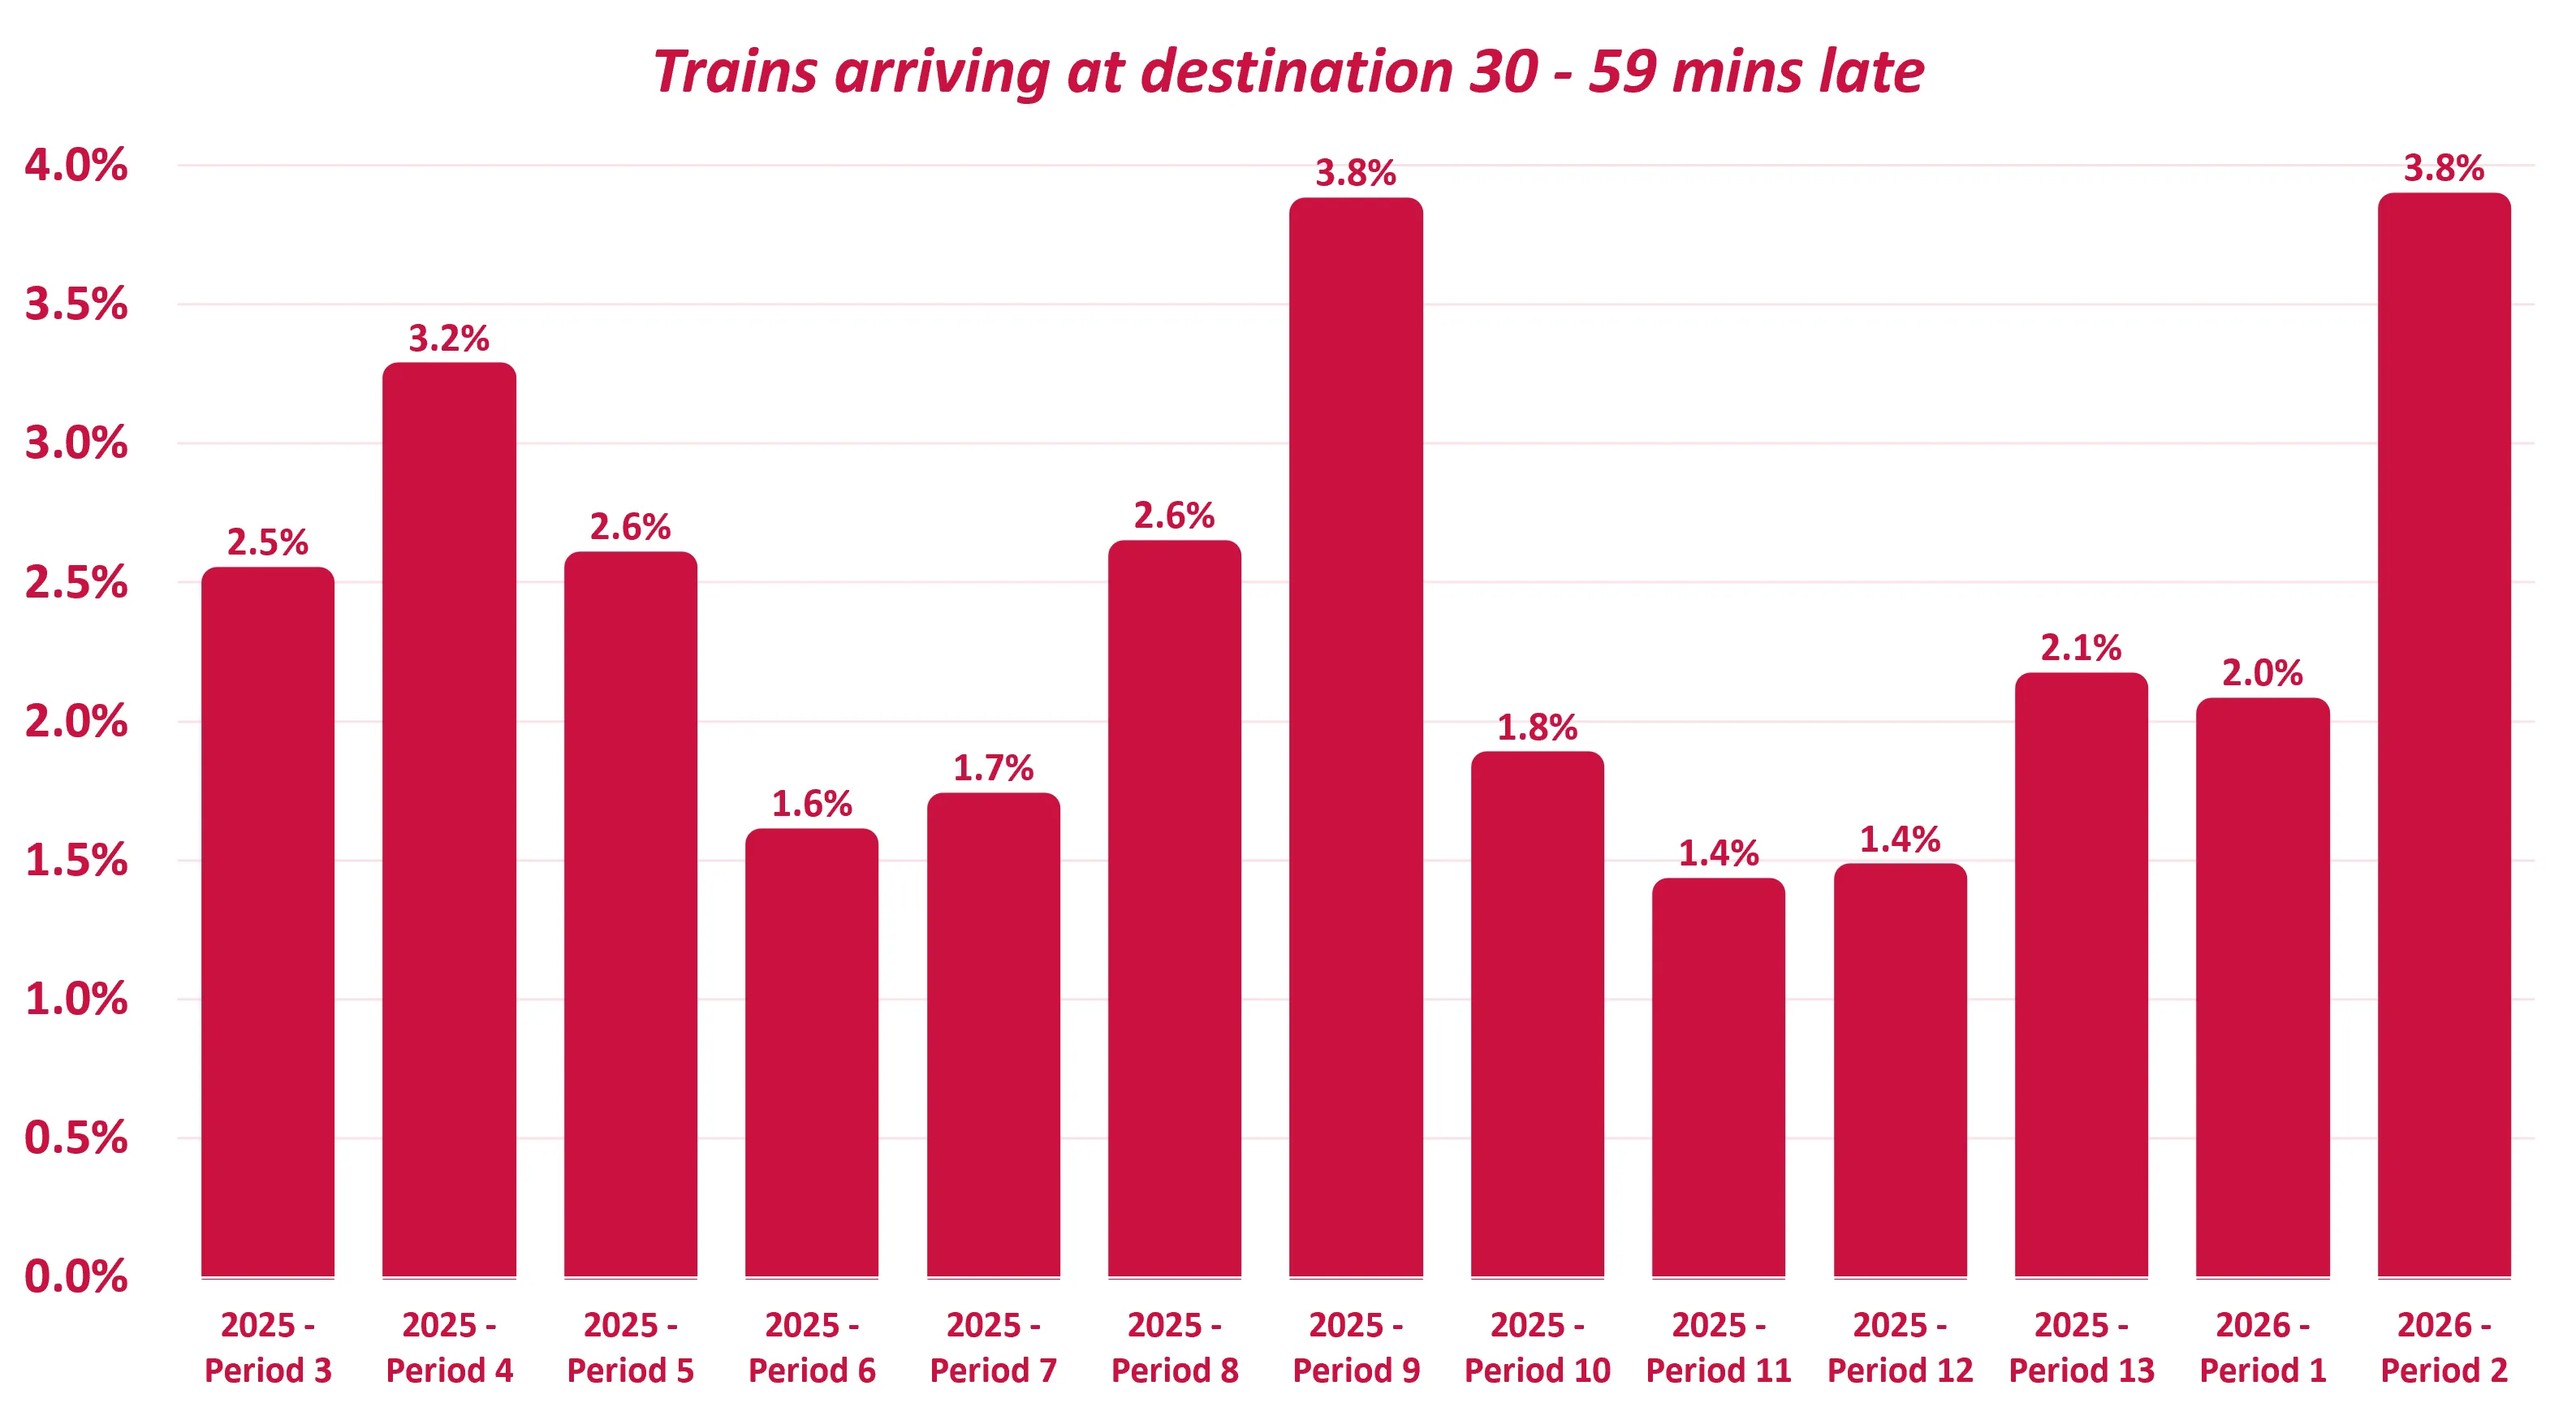
| Delays Between 30 - 59 minutes | Inter-city* | Inter Regional* | Overall | |||
| Rail Period | Actual | % | Actual | % | Actual | % |
| 2022 Period 8 | 141 | 5.3% | 47 | 1.4% | 188 | 3.1% |
| Period 13 | 54 | 2.1% | 21 | 0.7% | 75 | 1.3% |
| 2023 Period 1 | 82 | 2.4% | 24 | 0.8% | 106 | 1.6% |
| Period 13 | 74 | 2.3% | 28 | 0.8% | 102 | 1.5% |
| 2024 Period 1 | 62 | 2.2% | 17 | 0.5% | 79 | 1.3% |
| Period 13 | 56 | 1.6% | 17 | 0.4% | 73 | 1.0% |
| 2025 | ||||||
| Period 1 | 59 | 2.0% | 20 | 0.6% | 79 | 1.2% |
| Period 13 | 125 | 3.2% | 44 | 1.1% | 169 | 2.1% |
| 2026 Period 1 | 138 | 3.5% | 28 | 0.7% | 166 | 2.0% |
| Period 2 | 211 | 5.9% | 66 | 1.8% | 277 | 3.8% |
| Period 3 | 200 | 5.8% | 64 | 1.8% | 264 | 3.7% |
Trains arriving at station 60-119 minutes Late
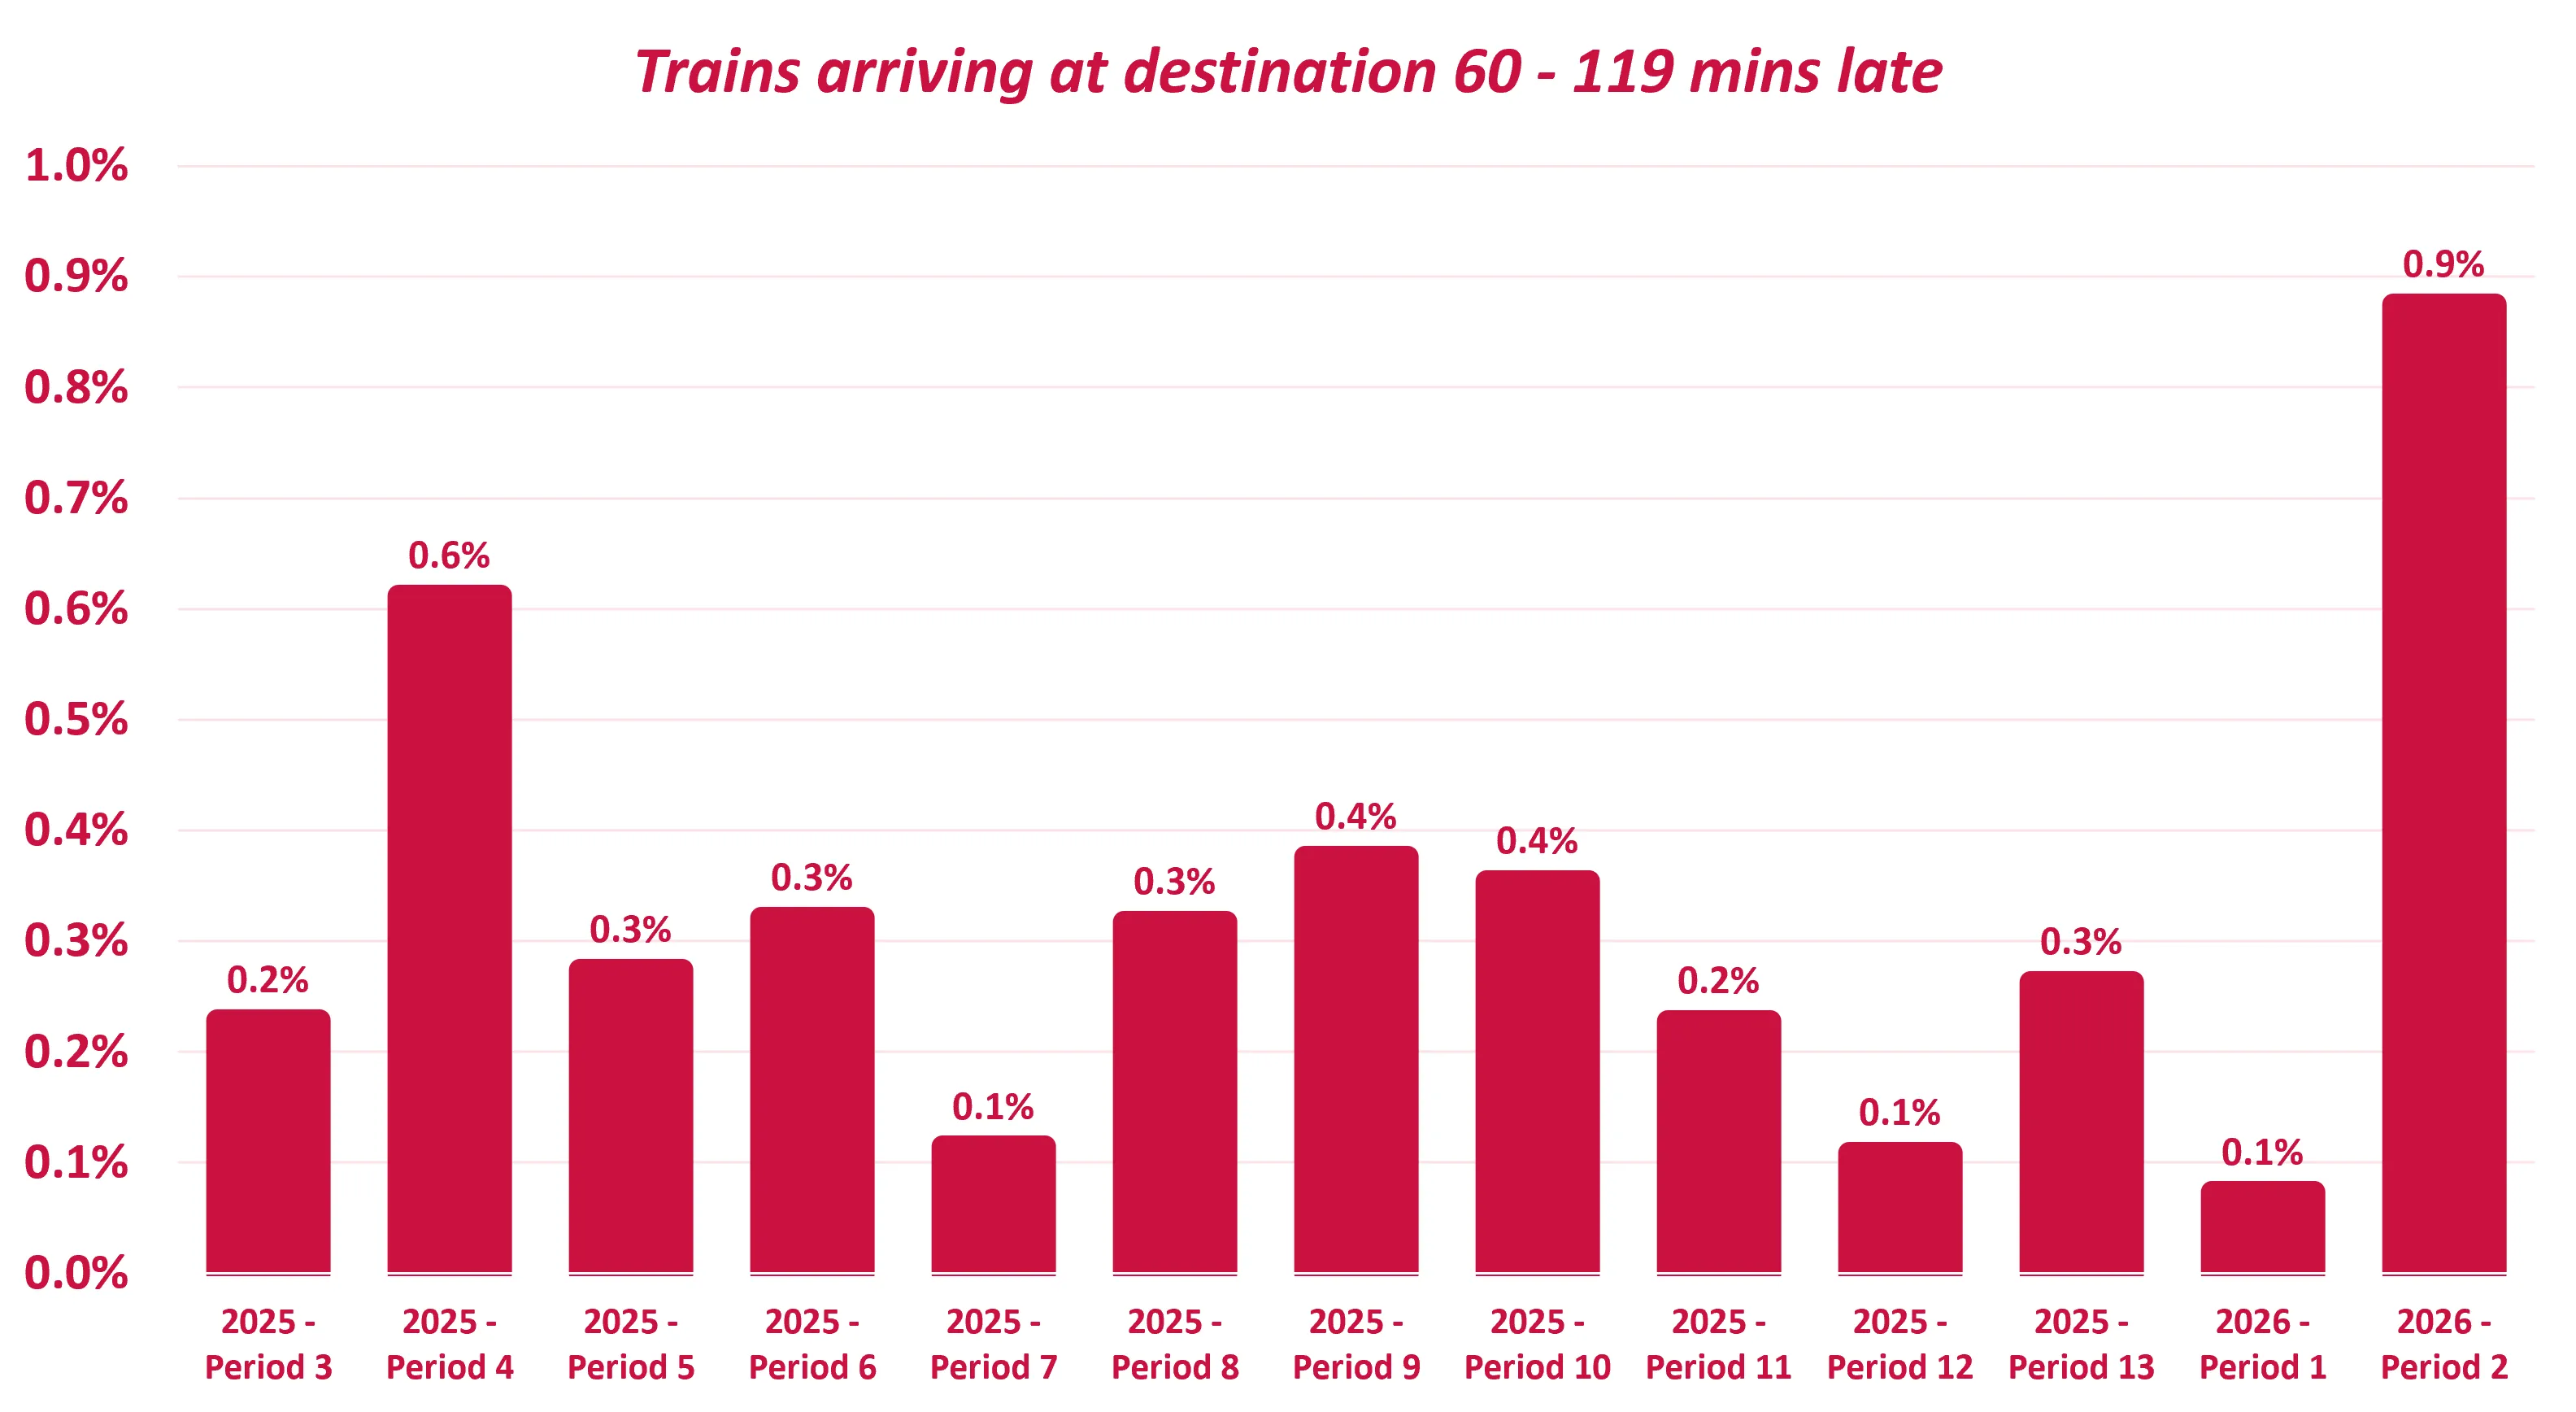
| Delays Between 60 - 119 minutes | Inter-city* | Inter Regional* | Overall | |||
| Rail Period | Actual | % | Actual | % | Actual | % |
| 2022 Period 8 | 36 | 1.3% | 2 | 0.1% | 38 | 0.6% |
| Period 13 | 6 | 0.2% | 1 | 0.0% | 7 | 0.1% |
| 2023 Period 1 | 14 | 0.4% | 0 | 0.0% | 14 | 0.2% |
| Period 13 | 10 | 0.3% | 2 | 0.1% | 12 | 0.2% |
| 2024 Period 1 | 10 | 0.4% | 1 | 0.0% | 11 | 0.2% |
| Period 13 | 4 | 0.1% | 1 | 0.0% | 5 | 0.1% |
| 2025 | ||||||
| Period 1 | 6 | 0.2% | 0 | 0.0% | 6 | 0.1% |
| Period 13 | 18 | 0.5% | 3 | 0.1% | 21 | 0.3% |
| 2026 Period 1 | 6 | 0.2% | 0 | 0.0% | 6 | 0.1% |
| Period 2 | 58 | 1.6% | 5 | 0.1% | 63 | 0.9% |
| Period 3 | 34 | 1.0% | 3 | 0.1% | 37 | 0.5% |
Trains arriving at destination over 120 minutes late
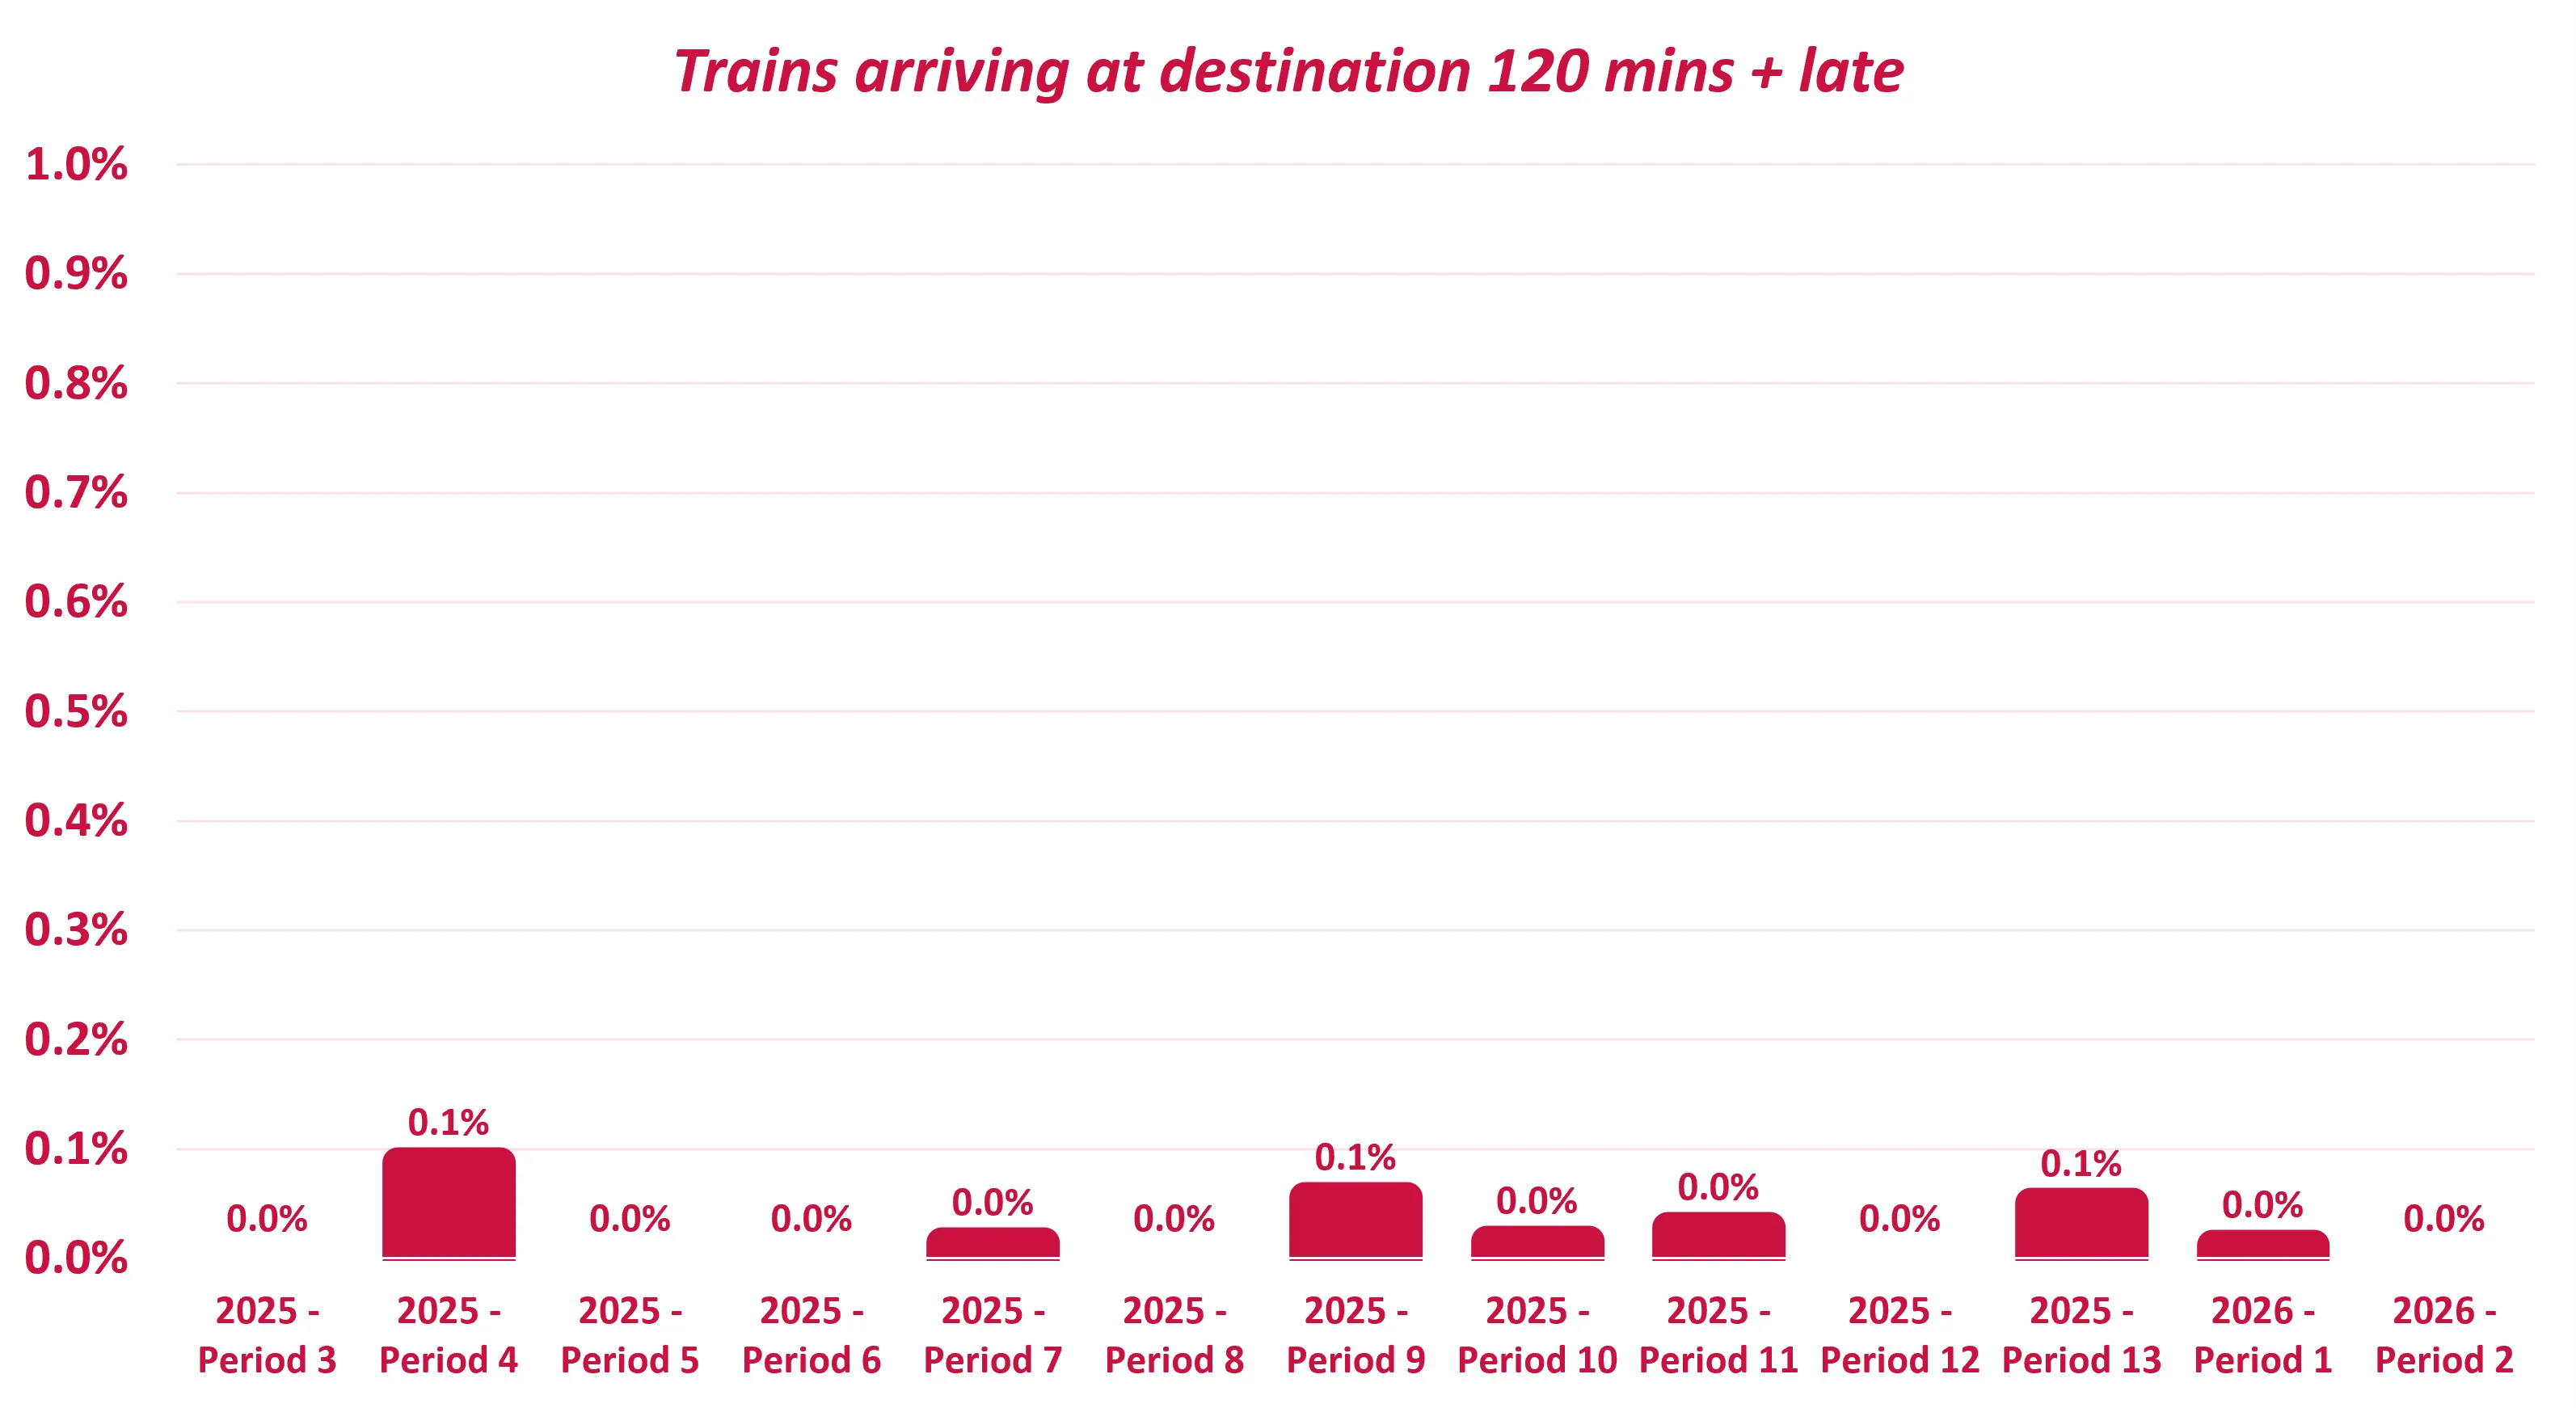
| Delays over 120 minutes | Inter-city* | Inter Regional* | CrossCountry | |||
| Rail Period | Actual | % | Actual | % | Actual | % |
| 2023 Period 1 | 0 | 0.0% | 0 | 0.0% | 0 | 0.0% |
| Period 13 | 3 | 0.1% | 0 | 0.0% | 3 | 0.0% |
| 2024 Period 1 | 5 | 0.2% | 0 | 0.0% | 5 | 0.1% |
| Period 13 | 0 | 0.0% | 0 | 0.0% | 0 | 0.0% |
| 2025 Period 1 | 1 | 0.0% | 0 | 0.0% | 1 | 0.0% |
| Period 13 | 3 | 0.1% | 1 | 0.0% | 4 | 0.1% |
| 2026 Period 1 | 1 | 0.0% | 0 | 0.0% | 1 | 0.0% |
| Period 2 | 0 | 0.0% | 0 | 0.0% | 0 | 0.0% |
| Period 3 | 0 | 0.0% | 0 | 0.0% | 0 | 0.0% |
Proportion of trains that were cancelled by CrossCountry
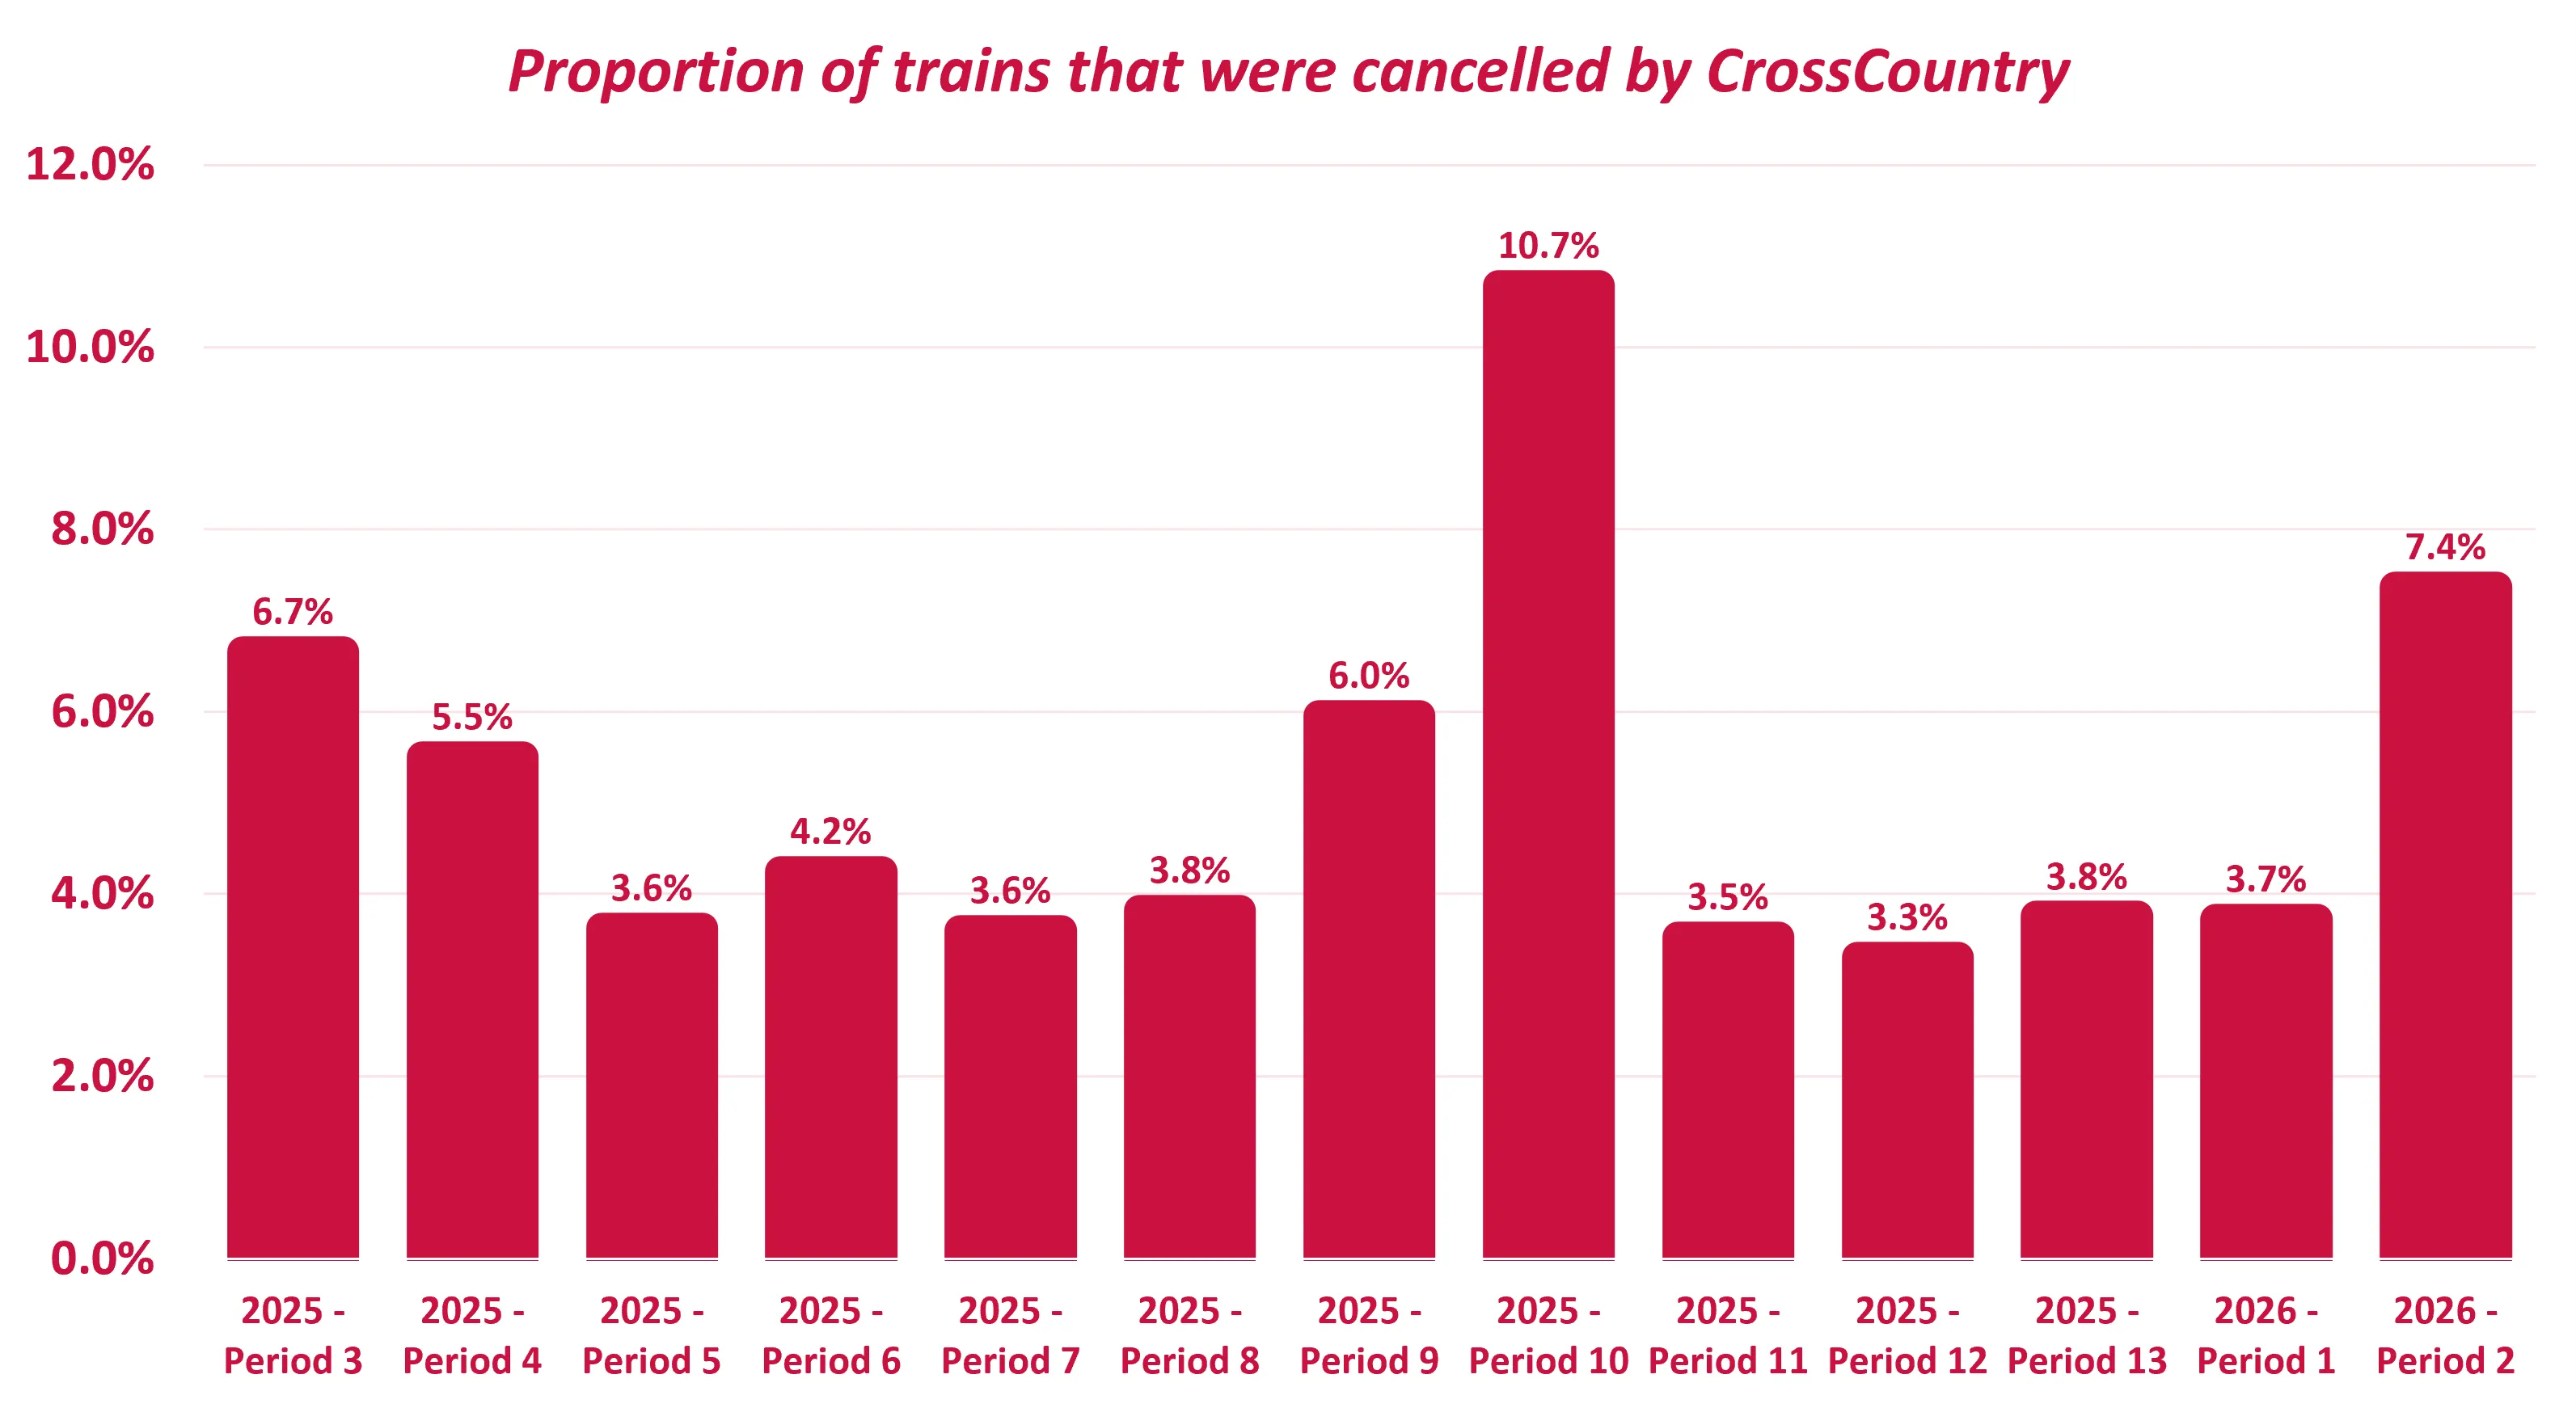
| CrossCountry Cancellations | Inter-city* | Inter Regional* | Overall | |||
| Rail Period | Actual | % | Actual | % | Actual | % |
| 2022 Period 8 | 128 | 4.8% | 425.75 | 12.3% | 553.75 | 9.0% |
| Period 13 | 41 | 1.6% | 76 | 2.4% | 117 | 2.0% |
| 2023 Period 1 | 67 | 1.9% | 140.5 | 4.4% | 207.5 | 3.1% |
| Period 13 | 51.5 | 1.6% | 59 | 1.6% | 110.5 | 1.6% |
| 2024 Period 1 | 94.75 | 3.3% | 82.5% | 2.5% | 177.25 | 2.9% |
| Period 13 | 94.25 | 2.7% | 147.5 | 3.8% | 241.75 | 3.3% |
| 2025 | ||||||
| Period 1 | 88.5 | 3.0% | 260.5 | 7.5% | 349 | 5.4% |
| Period 13 | 151 | 3.8% | 148.5% | 3.7% | 299.5% | 3.8% |
| 2026 Period 1 | 144.5 | 3.6% | 160 | 3.8% | 304.5 | 3.7% |
| Period 2 | 217 | 6.06% | 313.5 | 8.66% | 530.5 | 7.37% |
| Period 3 | 172 | 5.0% | 251 | 7.0% | 423 | 6.0% |
Service Quality Regime Results
To ensure we consistently deliver a high standard of service, we monitor and measure our performance across three key areas. Each regime is different and designed to support and improve different aspects of your journey with us.
The targets are set by the Department for Transport and we continually adapt our Service Quality Regime, which may result in some of our previously published scores changing over time.
If you're interested to find out more about what we are doing to improve the quality of our service, we publish a Customer Report twice a year which provides more detail of the actions we are taking and changes we have recently put in place.
2026-27
Train Service Regime
We’re committed to providing a comfortable, clean, and reliable on-board experience. This regime focuses on the quality of the train environment itself. This includes:
- Regular upkeep and maintenance of trains
- Cleanliness across all carriages
- Availability and condition of on-board facilities, such as toilets and Wi-Fi
| Service Quality Area | Ambience & Assets | Cleanliness | Information |
| Target | 70% | P01-P06 75% P07-P13 78% | P01-P06 87% P07-P13 89% |
| Period 1 | 61.05% | 71.36% | 89.06% |
| Period 2 | 62.71% | 71.94% | 91.06% |
| Period 3 | 63.43% | 71.81% | 88.62% |
Customer Service Regime
Customer service is at the heart of what we do. Our goal is to make your entire journey — from planning to arrival — as smooth and supportive as possible. This regime measures the overall quality of your experience when interacting with us, both digitally and in person. It covers:
- The usability and accuracy of our website and mobile app
- Interactions with our team, whether online, or on board
- Timeliness, clarity, and helpfulness of customer support across all contact channels
| Service Quality Area | Planning the Journey | The Train Journey | Planned and Unplanned Disruption |
| Target | 95% | 93% | 90% |
| Period 1 | 92.33% | 97.71% | 90.17% |
| Period 2 | 93.53% | 96.99% | 97.74% |
| Period 3 | 95.63% | 97.66% | 99.09% |
Accessible Customer Service Regime
We are committed to ensuring our services are accessible to all. This regime is dedicated to evaluating how well we support customers with accessibility needs. While similar in structure to the general Customer Service Regime, it focuses specifically on:
- Accessibility of facilities and digital services
- Availability of support for customers with reduced mobility or sensory impairments
- Training and responsiveness of our staff to accessibility needs
Please note that the performance indicators and targets for this regime are distinct, as they measure unique and vital aspects of accessibility support.
| Service Quality Area | Planning the Journey | Boarding and Alighting the Train | The Journey | Customer Service During Disruption |
| Target | 87% | 86% | 88% | 78% |
| Period 1 | 92.43% | 87.29% | 89.97% | 68.25% |
| Period 2 | 90.96% | 97.40% | 88.82% | 97.50% |
| Period 3 | 96.63% | 90.18% | 87.98% | 83.52% |
Past Results
| Service Quality Area | Ambience & Assets Includes lighting, interior condition and toilet operation |
Cleanliness Includes exterior and interior cleanliness |
Information Includes posters, announcements, and train information screens |
Information & Contact Includes staff helpfulness and information provision |
| Target (from Period 6) | 63.00% | 79.00% | 89.00% | 87.00% |
| Period 1 | 39.30% | 75.34% | 76.98% | 95.73% |
| Period 2 | 35.27% | 72.94% | 72.56% | 100.00% |
| Period 3 | 36.98% | 71.35% | 78.10% | 99.45% |
| Period 4 | 46.93% | 74.89% | 79.07% | 93.18% |
| Period 5 | 54.09% | 76.78% | 82.37% | 97.94% |
| Period 6 | 56.89% | 76.03% | 79.30% | 89.43% |
| Period 7 | 64.98% | 76.51% | 67.69% | 70.78% |
| Period 8 | 64.85% | 73.64% | 71.41% | 84.86% |
| Period 9 | 58.49% | 77.98% | 65.32% | 89.17% |
| Period 10 | 61.93% | 76.32% | 67.75% | 95.60% |
| Period 11 | 57.68% | 77.68% | 66.81% | 93.12% |
| Period 12 | 57.61% | 76.00% | 71.49% | 94.89% |
| Period 13 | 58.74% | 75.37% | 66.89% | 93.80% |
| Service Quality Area | Ambience & Assets Includes lighting, interior condition and toilet operation |
Cleanliness Includes exterior and interior cleanliness |
Information Includes posters, announcements, and train information screens |
Information & Contact Includes staff helpfulness and information provision |
| Targets P1 to P7 | 63.00% | 79.00% | 89.00% | 87.00% |
| Period 1 | 53.52% | 73.90% | 69.15% | 85.40% |
| Period 2 | 53.00% | 75.87% | 66.48% | 88.21% |
| Period 3 | 55.12% | 75.22% | 63.89% | 96.18% |
| Period 4 | 53.54% | 73.30% | 70.11% | 92.25% |
| Period 5 | 49.88% | 71.39% | 68.66% | 93.37% |
| Period 6 | 54.06% | 74.65% | 69.14% | 92.41% |
| Period 7 | 53.26% | 72.74% | 68.90% | 96.36% |
| Targets from P8 to P13 | 60% | 65% | 70% | 89% |
| Period 8 | 70.27% | 64.38% | 70.06% | 87.49% |
| Period 9 | 70.31% | 63.74% | 65.36% | 88.87% |
| Period 10 | 68.07 % | 61.59% | 71.07% | 88.76% |
| Period 11 | 67.67% | 63.74% | 72.58% | 89.19% |
| Period 12 | 69.76% | 64.33% | 71.26% | 91.44% |
| Period 13 | 69.07% | 63.67% | 69.93% | 94.83% |
Train Service Regime
| Service Quality Area | Ambience & Assets | Cleanliness | Information |
| Target | 68% | 75% | 77% |
| Period 1 | 71.48% | 71.51% | 85.93% |
| Period 2 | 63.00% | 64.38% | 78.12% |
| Period 3 | 58.07% | 63.43% | 80.76% |
| Period 4 | 61.50% | 65.58% | 81.49% |
| Period 5 | 59.10% | 66.65% | 75.85% |
| Period 6 | 57.41% | 68.15% | 83.80% |
| Period 7 | 62.23% | 68.17% | 85.50% |
| Period 8 | 65.13% | 67.57% | 84.75% |
| Period 9 | 61.00% | 66.66% | 81.83% |
| Period 10 | 61.86% | 71.64% | 88.20% |
| Period 11 | 61.20% | 72.10% | 88.49% |
| Period 12 | 61.81% | 72.73% | 71.82% |
| Period 13 | 59.76% | 69.41% | 89.04% |
Customer Service Regime
| Service Quality Area | Planning the Journey | The Train Journey | Planned and Unplanned Disruption |
| Target | 85% | 83% | N/A |
| Period 1 | 88.51% | 90.51% | 83.46% |
| Period 2 | 88.63% | 88.71% | 82.96% |
| Period 3 | 86.23% | 93.29% | 69.28% |
| Period 4 | 89.32% | 92.83% | 88.17% |
| Period 5 | 89.65% | 95.62% | 87.87% |
| Period 6 | 88.50% | 85.96% | 83.80% |
| Period 7 | 87.71% | 90.59% | 82.08% |
| Period 8 | 86.52% | 86.47% | 88.75% |
| Period 9 | 89.87% | 89.74% | 84% |
| Period 10 | 86.76% | 96.59% | 89% |
| Period 11 | 90.44% | 93.97% | 89% |
| Period 12 | 92.06% | 87.98% | 90.68% |
| Period 13 | 94.91% | 93.42% | 87.86% |
2025-26
Train Service Regime
Service Quality Area | Ambience & Assets | Cleanliness | Information |
Target | 68% | 75% | 83% |
Period 1 | 61.01% | 70.22% | 88.72% |
Period 2 | 60.05% | 72.88% | 91.17% |
Period 3 | 59.89% | 71.34% | 88.67% |
Period 4 | 58.20% | 68.70% | 85.48% |
Period 5 | 58.76% | 73.92% | 90.37% |
Period 6 | 56.74% | 71.54% | 88.54% |
Period 7 | 59.91% | 75.12% | 90.64% |
Period 8 | 60.74% | 73.24% | 86.76% |
Period 9 | 60.09% | 76.55% | 89.97% |
Period 10 | 59.15% | 75.67% | 87.64% |
Period 11 | 57.94% | 74.38% | 91.02% |
Period 12 | 58.12% | 71.96% | 88.70% |
Period 13 | 58.43% | 71.88% | 87.07% |
Customer Service Regime
Service Quality Area | Planning the Journey | The Train Journey | Planned and Unplanned Disruption |
Target | 89% | 89% | 83% |
Period 1 | 95.02% | 96.28% | 93.67% |
Period 2 | 98.14% | 93.92% | 100% |
Period 3 | 98.35% | 96.10% | 94.43% |
Period 4 | 98.28% | 93.98% | 90.00% |
Period 5 | 97.02% | 94.27% | 94.09% |
Period 6 | 97.54% | 96.44% | 97.98% |
Period 7 | 98.71% | 93.81% | 83.25% |
Period 8 | 94.10% | 94.66% | 87.50% |
Period 9 | 94.42% | 95.17% | 97.92% |
Period 10 | 91.15% | 95.65% | 86.79% |
Period 11 | 92.86% | 99.63% | 96.16% |
Period 12 | 95.11% | 96.95% | 89.42% |
Period 13 | 95.78% | 96.31% | 89.85% |
Accessible Customer Service Regime
Service Quality Area | Planning the Journey | Boarding and Alighting the Train | The Journey | Customer Service During Disruption |
Target | 83% | 83% | 83% | P01-P04 73% |
Period 1 | 94.00% | 90.64% | 89.84% | 83.33% |
Period 2 | 88.42% | 93.98% | 89.39% | 86.84% |
Period 3 | 80.00% | 96.49% | 90.13% | 52.75% |
Period 4 | 87.24% | 93.53% | 89.90% | 100.00% |
Period 5 | 95.60% | 81.89% | 93.04% | 73.57% |
Period 6 | 87.47% | 88.65% | 90.71% | 51.25% |
Period 7 | 84.07% | 92.31% | 90.49% | 95.00% |
Period 8 | 93.76% | 95.54% | 92.35% | 86.71% |
Period 9 | 91.67% | 78.75% | 80.79% | 68.86% |
Period 10 | 98.40% | 80.98% | 90.00% | 44.44% |
Period 11 | 99.00% | 89.12% | 89.31% | 75.83% |
Period 12 | 91.77% | 90.87% | 92.70% | 92.88% |
Period 13 | 93.59% | 88.53% | 91.27% | 98.21% |
Introducing the Customer Information Pledges
When you travel with us, if things don’t go to plan, you need the best information as quickly as possible. Our customers tell us that there are things we could do better when things go wrong - and other operators across the industry are hearing this too. Please visit here for more information.


